
By A. Christopher Wikman
Preface by Vince Giuliano
I see this article by Chris Wikman as highly relevant for anybody who wants to understand their own health or enhance their longevity. Historically, fundamental scientific discoveries and technologies have been based on new instruments that allow us to observe phenomena that we had no clue existed because they are are unperceivable to our native senses. In astronomy, the telescope, and new space telescopes like the Hubble and Web led us to radical new understanding the universe in which we exist. In physics, generations of atom smashers enabled us to understand the fine structure of matter and energy. In chemistry, spectrascopes allow us to differentiate between tiny samples of materials and tell us the compositions of impossibly distant entities in the universe. In biology the microscope led us to discover microbes and viruses. And X-rays MRIs and PET Scanners enable us to understand what we are made of and how we work. Most of what goes on in our bodies relevant to our health and longevity is invisible to our conscious senses. But much of it can be observed and monitored by available instrumentation. If we want to optimize our health and longevity, the first step is to know what it is.
Introduction
In my last article for this blogsite, Biometrics and Aging, we talked about how to assess your Biological Age, which could be helpful in finding out how well the various anti-aging interventions you may be using are working for you. Beyond waiting for those results, there are of course many other and related things you can do to improve your health and fitness, some of which may not be apparent without some analysis.
Welcome to the world of the quantified-self – also referred to as self-tracking, self-monitoring, lifelogging, personal analytics, and personal informatics. (BTW, bio-hackers are often also self-trackers.) Being the analytical and data-driven guy I can be at times, and subscribing to the idea of ongoing self-improvement, I’ve been keeping detailed, quantitative as well as qualitative personal records related to my health and fitness for over 10 years. (As with many self-trackers, this was initiated by some personal health issues.) But without the subsequent analysis, conclusions, and resulting actions and changes in my behavior, all that data would not be worth much.
As noted by Dr. Allen Neuringer back in 1981, and later by Swan, [The Quantified Self: Fundamental Disruption in Big Data Science and Biological Discovery, 2013], Sanctorius of Padua studied energy expenditure in the 16th century in living things by tracking his weight vs. food intake for 30 years. Self-experimentation examples can be found onwards through to today, but often in isolation. While an actual Quantified-Self (QS) community was initiated in 2007, studies and articles about this movement seem rare until around 2012. Even today, though, most people seem unaware of this pursuit outside of those who do it and their close relatives and friends. Although there are exceptions, a general bias against personal science by the medical community exists. The bases include valid concerns such as n=1 sample sizes, lack of rigid objectivity and the resulting possible effects of expectations, and questions about expertise. The QS organization has established a study protocol to help address this. But many self-trackers may not even be aware of it. A Pew study in 2012 estimated that 35M Americans were self-tracking (QS website, accessed Jan 2023). And by 2019, 62M, per a Gallup poll (FiveThirtyEight, an ABC Internet News outlet), access Jan 2023. But I suspect these numbers are based merely on how many people are using wearables. Many are gathering and saving reams of data, intentionally or not, but probably not that many are actually managing their health and adjusting their behavior using that data.
And so, while some people use their devices and thus capture data, but rarely look at it, some review it, some log it, analyze it, do correlation studies, make conclusions about what works and what doesn’t, and use the results to manage their behavior and health. With self-knowledge, one is better prepared to self-advocate, such as with your healthcare providers. Knowledge is power, or as Dr. Allen Neuringer stated in 1981, “knowledge utilized is power”). One would strive to be healthy longer than otherwise, if not live longer too.
There are steadily increasing research studies and reviews regarding the self-tracking movement. A seemingly obvious and important research question is “are self-trackers actually healthier?” Are we actually benefiting from the effort? There does not seem to be much evidence yet, perhaps due to lack of research on this specific question. Much of it seems focused on whether or not the subjects simply used a wearable device. The 2019 study “Impact of Personal Health Records and Wearables on Health Outcomes and Patient Response: Three-Arm Randomized Controlled Trial concluded that people who wore wearable devices and used an associated app lost more weight than controls. There were “positive effects of digital self-tracking by patients undergoing cardiac rehabilitation on performance of the cardiovascular system”, from Vogel, 2017, vs. the control group who did not use wearable fitness trackers during rehab. Others reported some evidence that using a wearable fitness tracker also benefits other household members. But on the other hand, a study (summarized on “The Conversation” news site, accessed in Jan 2023) by scientists Conger, Bassett, and Toth, found that physical activity levels have actually declined from 1995 to 2017, despite the surge in wearable fitness trackers. So it seems we can’t really say whether the QS community as a whole is healthier for doing so, but I’m confident that the work I’ve done has been beneficial (see below), and I’m also sure that many self-trackers would say the same.
How to Conduct Self-Tracking (in a Nutshell)
Now for a short digression to review what’s involved for new aspirants. Typically, there are two approaches – 1) review existing data and look for patterns, etc., or 2) create a hypothesis and/or experiment, collect the data, and see if the hypothesis is confirmed. The knowledge and skills involved may include making informed decisions about what data to collect and analyze, and some familiarity with analysis tools or apps/applications (such as spreadsheets) – which also entails using some type of computing and data storage device. For do-it-yourselfers, some knowledge of statistics can be helpful. While this approach gives you greater flexibility on what to look at, the apps associated with wearable devices is becoming very sophisticated, such as the WhoopTM strap’s monthly insight report. While there are many options to choose from (or not – I have at least four), there are those in this community who use just paper and pencil and manually collected data, without a fitness tracker at all. Figure 1 below is sample process flow diagram.
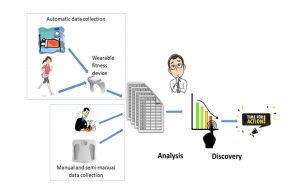 Figure 1 – Example of a Self-Tracking Process
My Self-Tracking Story
Now, more specifically, I’m going to review here many aspects of what I do, and what I’ve learned, concluded, or verified. Many of them seem obvious, but one-size-fits-all doesn’t always apply. The monthly summary report by WhoopTM lists the positive and negative impacts on your overnight recovery, in terms of percentages. The results of some of my interventions are at odds with the averages of the general Whoop user population, and I suspect that this is the case for many other users.
Table 1 below lists the devices I use.
Table 1 – Personally-owned and used data gathering devices
| Data Gathering Device | Data |
| Digital scale | Weight, BMI, muscle and bone mass, water content |
| Digital thermometer | Body temperature |
| Blood pressure monitor | Blood pressure, heart rate |
| Pulse oximeter | Blood oxygen, heart rate, respiration rate |
| Fat caliper | Subcutaneous body fat |
| Dynamometer | Grip strength |
| Blood glucose meter | Blood glucose |
| Blood lactate meter | Blood lactate |
| Nitric oxide test strips | Nitric oxide levels |
| Various wearable devices | Heart rate, calories, sleep quality and quantity, HRV (heart rate variability), daily steps, derived measures such as overnight recovery from resting and associated mobile-device-based apps |
| NeuPT tech HRV Diagnostic System | HRV and related indicators |
| RLM Diagnostics BIA device | Phase angle, (estimated) basal metabolic rate (BMR) |
Table 2 below provides details on the data I’ve collected. The list is not exhaustive, as I have somewhere around 150 spreadsheet tabs (some being graphs only) in my four main files. Generally I have 8-10 years of data, some as little as 2, some as much as 33 (at times sparse) years. Some of my ideas did not bear fruit, and so I abandoned further data collection, some served their purpose and I moved on, and some of my records are from before I became serious about this.
Table 2 – Personal Data Collection Inventory
| Category of item tracked/ analyzed |
Item(s) (Recorded data varies from daily, weekly, monthly and ad hoc. Not always continuous) |
Years of Data | Associated analyses (many analyses result in documented conclusions and possibly suggested actions and behavioral changes, and may include data graphs) |
| Symptoms (of note, not necessarily every day) | Daily tracking sheet | 9 | * Correlation studies with season/time of year * Correlation with vacations/trips, especially in the 1-3 months after strenuous trips, and differences between trips, home, and other trips (foods, temperatures, activity levels, etc.) * Megatrends of symptoms vs. med and supplement changes, and identification of candidates with significant affects * Personal differential diagnoses/analyses and conclusions * Correlations of symptoms with genetic testing results – 23andMe and four different associated 3rd party interpretations, and Whole Exome Sequence based upon phenotype |
| Health interventions | Such as sauna, exercise, massage, meditation, etc.) | 8 | * Correlation with health metrics such as HRV |
| Invasive lab tests | Bloodwork, various | 17 | * Time series and seasonal variations (such as immune function and thyroid levels) * Selected assessments of assay results vs. time of day drawn (e.g. cortisol) * Calculation of and plots of (non-reported) WBC ratios such as neutrophils to lymphocytes * Comparison of various micronutrient assays between serum levels, cellular levels, and cellular level functional assessments. (Serum levels don’t always tell the whole story!) * Intake levels vs. blood assay levels for selected micronutrients * Cellular senescence assessment based upon immune and inflammation markers * Which “common” blood markers levels change significantly during exercise, and do mine track with expected norms? (small data set) |
| Blood glucose (at home as well) | 9 | * Time series trends * Small data set of 24 hour monitoring * Changes due to acute intake of specific meds and supplements |
|
| Blood and urine pH | 9 | ||
| Lactic acid – at home device | 3 | * Vs. heart rate (sometimes during exercise) and pH | |
| Non-invasive measurements | Phase angle, whole body, electrical – clinic and at-home | 8 | * Time series trends, correlation with physical activity levels and some supplements |
| Blood pressure | 33 | * Time series, hourly variations, seasonal variations, and in relation to meds and supplements changes. Correlation with symptoms * Potential causes of hypertension and personal assessment of which match my situation * vs. caffeine intake * vs. med changes |
|
| Neurocognitive | 8 | * Time series trends | |
| Cardiovascular | 10 | * Trends | |
| HRV (including implied stress level, power and frequency bands) | 7 | * Period averages * Correlation studies with 20+ various interventions and behaviors (post-massage, yoga, etc., as well as negative stressors), as well as med and supplement changes. How do these affect HRV the day after, the 2nd day after, the week after? Statistical t-tests on strength of different interventions * Effects on HRV of days between repeat interventions (such as how frequently to do something helpful, such as sauna) * Trends over days of the week, months of the year/seasons * Correlation between HRV assessments by three different apps/devices |
|
| BMR, Metabolic rate | 8 | Company specialists from one device mfr. have adjusted the formulaic value used in my profile to match actual data which I provided them from my personal records, rather than using an estimate | |
| Body Temperature | 7 | * Hourly variations vs population norms * Changes vs. med changes |
|
| Pulmonary function (at least 8 aspects measured) | 11 | * Time series trends, changes in relation to interventions, behaviors, and med changes | |
| Photoplethysmography | 7 | * Time series trends, seasonal variations, changes in relation to interventions, behaviors, and med changes | |
| Sleep quality and quantity, – mostly monthly averages | 7 | * Correlations with activity levels, adjustable mattress firmness levels, selected meds and supplements (e.g. melatonin), mattress cooling pad settings, sleep interruptions | |
| RHR, heart rate | 9 | * Time series trends – monthly, hourly, yearly * Small data set of 24 hour cardiac monitoring |
|
| Respiration rate | 11 | * Changes in relation to behavioral changes | |
| Nitric oxide levels (salivary at home) | 7 | * Changes in NO levels vs. various supplements such as citrulline and beet root extracts | |
| Imaging studies | 6 | * Changes/trends in DEXA scan results | |
| Anthropometric | Weight | 10 | * Time series and seasonal variations |
| BMI | 10 | ||
| Fat/Water/Bone/Muscle % | 10 | *Time series trends | |
| Meds, Vitamins, Supplements, etc. | For all items, dosage, why taken, incl. details (assay evidence, symptomatic evidence, research support for good health), start/stop dates, status changes, | 10 | * Co-factor dependencies (such as Vit. B3 and B6 , and copper’s) effect on other micronutrients and blood biomarkers * Associated symptoms and diseases caused by deficiency of selected micronutrients, and correlation with personal situation * Receptor actions of agonists/antagonists for various classes of meds, such as stimulants * Serving content and lipid-type distribution of various lipid supplements (such as fish oils) vs. blood assay levels/deficiencies * See also other categories |
| Vaccines received | 9 | ||
| Physical performance measures | Workouts of note (avg. of 15/year). What, how long, pre and post meals/drinks, performance assessment and suggested actions, Watts/calories/METS, MET-hrs, distances, etc. | 10 | * Peak exertion accomplished year to year * HR, calorie count, and distances correlations between 5 different devices * Activity level in watts achievable while maintaining same heart rate over time (training effects) * Performance achieved at high altitude vs. “sea level” * Some data on SPO2 while at altitude (10,000-19,000 feet ASL) and during some breathing practices * Incline angles and distances of various local training sites |
| Stationary Bike time trial results | 9 | * Time series trends and in relation to med changes | |
| Roughly 20 different fitness measures (VO2max, W/kg, squat strength, etc.) | 9 | * Each is scored red/yellow/green/blue * Which measures are affected by which meds * Some assessments and normalization for comparison to aged matched norms |
|
| Various | 9 | * Assessment of 33 physiological processes/aspects affecting cardiovascular physical performance (O2 delivery, fuel delivery, neuromuscular control, etc.). Identification of “weak” aspects, and which micronutrients have potential positive impact. | |
| Fitness device data | FitBit – average monthly steps, etc. | 5 | * Time series, seasonal, and pre-/post- highly stressful multi-day events, such as high altitude trekking excursion |
| Oura ring – Readiness, HRV | 3 | * Time series trends. Year to year changes * Correlation of Readiness with prior/recent activity levels and sleep – next day, next week |
|
| Whoop strap – Recovery, Strain, HRV, etc. | 1 | * Time series trends, including monthly average impacts of interventions, behaviors, and stressors. * Correlation of Recovery with prior/recent activity levels and sleep – next day, next week – what is the “sweet spot” for me, vs app’s recommendation? * Strain/hour vs. avg. heart rate during exercise |
|
| Garmin sports watches | 5 | ||
| Other devices, such as Basis Peak | ? | ||
| Doctor visits and medical background info | Date, topics for discussion, complaints (if any), visit outcome | 10 |
What have I learned or uncovered?
The extent of all this may lead the sympathetic reader to be concerned about my health. Most of us go through good and not so good periods as we get older. But I can say that I’m generally healthy enough and physically fit, to the extent that often I’m the oldest person on my trekking and mountaineering trips, and can generally keep up with the group. During this period of intense data collection, there was a day when I expended 7,000 calories, followed up by another very active day of hiking with a heavy pack. On another trip I averaged 4,000 to 5,000 calories per day for a week – almost like doing a marathon a day. So no worries.
General Health
Devices like the Whoop strap help you to manage your training or even just general activity levels. I found that when my overnight Recovery was poor, and then was too active, drank alcohol, and stayed up late, I felt very poor the following day. But to my surprise, I also found that if was too sedentary, I also didn’t do as well. Some minimal level of activity was better for me, even though I felt that I needed the rest.
The strenuous trips which I take do seem to eventually take their toll. In the past, I would seem to succumb to a cold or some other illness shortly after a stressful event. While I seem to have overcome that issue, there still seem to be dips in my health a few months afterwards. Something to work on.
I concluded that my blood calcium scores are higher during the not-so good periods. Also something to figure out perhaps.
Along the way, my doctors have helped me uncover some micronutrient deficiencies. (Many people are probably deficient in magnesium, for example.) Over a period of years, and by obtaining assays (some specialized) at the levels of blood/serum, WBC intercellular, and functional pathway metabolites or cellular viability, one can get clues to possible gut absorption issues or cellular membrane issues, for example. Further, by creating and analyzing a matrix of co-factor dependencies, and perhaps comparing to symptoms, one may get insight into unsolved issues (e.g. Vitamin B6 and magnesium affect a lot of process in the human body). I was able to significantly reduce my triglycerides by correcting a deficiency which “no one is deficient in”. For every medication or supplement that I take, I have dated records of changes/add/deletes, dosages, why (assay results, empirical symptoms, and/or medical research (i.e. longevity benefits), and sometimes other notes. With this, I have been able to look back in time and pose questions about what was I taking at that time. Most of what goes on in our bodies is invisible to our senses but much of it can be observed and monitored by relatively available instrumentation.
By looking at my HRV records, I was able to ascertain that my SNS activity was higher on one of two alternative medications, and to decide on which one to use accordingly.
My blood pressure records allowed me to conclude that my BP didn’t actually change much while on two different medications, together and alone. When I suspected that they were causing unacceptable side effects, I made the decision to discontinue their use, in consultation with my physician. I was also able to conclude that fatigue and BP were not correlated during the day.
Sleep
I’ve looked into how the following effect my sleep quality and quantity, and made adjustments and decisions accordingly – bed firmness (adjustable), melatonin dose, using an extra blanket (not), and whether I exercised or not that day.
The OuraTM ring, among other devices, calculates your respiration rate (RR) overnight. An observational analysis of mine revealed that my RR has been generally and steadily declining over the last 18 months or so, totaling about a 13% decline overall, after being somewhat steady or even some slight increase for the prior 18+ months. After some thought, I realized that this trend coincided with my developing interest in Breathwork (and a topic of an upcoming blog article). I conducted an online webinar on healthy breathing practices at that time and began to consciously practice this. Further, the healthy breathing practices seem to have significantly improved my lung health, based on spirometry results vs. earlier records.
Heart Rate Variability
HRV is a great single measure of whole-body health, even though sometimes it doesn’t seem to match exactly how you’re feeling. (But generally, mine has some correlation to how I’m feeling.) My HRV is higher when I’m seeing my acupuncturist, doing high-intensity intervals (HIIT) weekly, getting time outdoors and especially sunshine. Outdoor time is good – my numbers go up the day after getting time outdoors and also the 2nd day afterwards. At least 30 minutes of sunshine seem to be the minimum, and more is better – incremental benefits. Quantity of sleep helps, but apparently quality not so much.
Other positive effects on my HRV include regular sauna visits, and using topical magnesium cream. Most months, I enter the Whoop monthly results into a spreadsheet to 1) re-confirm my top behaviors and interventions, both relative and absolute, and 2) look for trends in the results indicating which behaviors are either (seemingly) becoming more effective, or else no longer having the effect that they once did – thus identifying opportunities to do things differently.
I have been experimenting with the Apollo Neuro strap (to boost my HRV). The device offers multiple protocols, for different purposes, and I find that the “Sleep and Renew” is best for me overnight.
Seasonal Aspects
Many of us are aware that the seasons affect our moods, especially as we get farther from the equator. I was able to confirm that my HRV varies seasonally (get heat and sun in the winter?). Further, when some of my neurotransmitter or hormone levels are “low”, this seems to occur only in late winter and early spring. So after reviewing 9 years of fatigue-levels records, I was able to confirm a highly seasonal correlation – late summer is best, late winter is worst.
My average daily steps are highly correlated with the hours of sunshine per month. No big surprise there, living in a 4-season temperate climate. Have I corrected this? Probably not yet.
Physical Performance
During one period of time, an undiagnosed health issue was causing symptoms when hiking in hilly terrain. I started keeping records on things to try and vary, and the resulting outcomes, in order to explore and gain some insight into what was going on. These included warm-up time duration, wearing nose strips, supplements such as carnitine, and stimulants such as caffeine and epinephrine (don’t try this). Alcohol the day before was a negative influence.
I also investigated what was my minimum duration of warm up time before HIIT vs. the level of intensity that I could achieve, before the benefit leveled off.
Pulling data from several records, prompted by occasionally having some issues with exercise recovery, I compiled a table of 32 aspects contributing to aerobic performance (oxygen uptake, bloodstream fuel, cardiac condition, etc.), and assigned color grades to each based on my situation, and assessed which micronutrients, if deficient, might impair that aspect. A work still in progress as far as strong conclusions go.
Sometimes we stumble upon already existing scientific knowledge, such as ‘hormones and our immune systems vary with the seasons’, such as I did by tracking hormone and antibody levels, and WBC counts. Am I better off today than I was, given the large amount of time invested? It’s difficult to prove objectively – my health is better in several ways, but it would be very hard to single out individual causes vs. the noise. I’d do it again though.
Others Self-Tracking
What about others – what other types of experiments, analyses, self-evaluations have they done? There are many examples, including formal briefings and papers on the QS website (and likely elsewhere). Here I draw a few examples from Dr. Neuringer. One female student of his analyzed the relation between how much food she ate during the day and how well she slept. (Curiously, less food led to less sleep). Another student of his hypothesized large effects on his memory the morning after smoking marijuana, but found none [or at least couldn’t remember if he did? ☺ – Ed.] Further, Dr. Neuringer conducted several self-studies on whether and how walking vs. sitting affected various tasks such as generating “new” ideas, problem solving, and memorization – his performance was better while these were done while walking. (But apparently this conclusion hasn’t always been confirmed in some N>1 studies.) [Perhaps add more examples? And other organizations?]
Possible Issues and Concerns, and Summary
The personal time commitment can be heavy, leaving less time for other things. I find that this goes in phases, in my situation. Running self-experiments can require adding more variability to one’s life (“let’s try this, and this, and…”), which can add stress. And some seeming-critics of the QS community raise concerns about “data fetishism”. Fetishes are numerous. I doubt this is a problem for most of us. Perhaps privacy is the main concern here. Personal data is abundant, ubiquitous, and for sale. Several research studies on QS seem to be probing after the donation (data philanthropy) of self-tracker’s data, for research and just as likely commercial use. Decisions are to be made.
One of the emerging lines of inquiry, despite the medical profession’s concerns, is whether there can and will be reverse transfer of knowledge, from society to science? As of 2019, there appears to be nothing of note. One can only hope that this might change. Dr. Neuringer quipped in 1981, foreseeing a possible future in which self-experimentation became common, people would greet each other with “what experiments are you doing” rather than common variations of “how are you?”. And this was before the recent availability and exponential growth of many types of wearable trackers.
From Swan (above), “the cycle of experimentation, interpretation, and improvement transforms the quantified self into an improved ‘higher quality self’”. Or as Neuringer put it, “The solution to many of our problems is not a pill, not a product, but rather a continuous process of discovery and change”.
References
Kim JW, Ryu B, Cho S, Heo E, Kim Y, Lee J, Jung SY, Yoo S. Impact of Personal Health Records and Wearables on Health Outcomes and Patient Response: Three-Arm Randomized Controlled Trial. JMIR Mhealth Uhealth. 2019 Jan 4;7(1):e12070. doi: 10.2196/12070. PMID: 30609978; PMCID: PMC6682299.
Feng S, Mäntymäki M, Dhir A, Salmela H. How Self-tracking and the Quantified Self Promote Health and Well-being: Systematic Review. J Med Internet Res. 2021 Sep 21;23(9):e25171. doi: 10.2196/25171. PMID: 34546176; PMCID: PMC8493454.
Kim J. Analysis of health consumers’ behavior using self-tracker for activity, sleep, and diet. Telemed J E Health. 2014 Jun;20(6):552-8. doi: 10.1089/tmj.2013.0282. Epub 2014 Apr 18. PMID: 24745608; PMCID: PMC4038997.
Deborah Lupton (2017) Self-tracking, health and medicine, Health Sociology Review, 26:1, 1-5, DOI: 10.1080/14461242.2016.1228149
Lupton D. “Sharing Is Caring:” Australian Self-Trackers’ Concepts and Practices of Personal Data Sharing and Privacy. Front Digit Health. 2021 Feb 23;3:649275. doi: 10.3389/fdgth.2021.649275. PMID: 34713123; PMCID: PMC8521845.
Meyer J, Gurrin C, Price B, Kay J, Jain R. Editorial: Long-Term Self-Tracking for Life-Long Health and Well-Being. Front Digit Health. 2021 Dec 24;3:827586. doi: 10.3389/fdgth.2021.827586. PMID: 35005699; PMCID: PMC8738079.
Swan M. The Quantified Self: Fundamental Disruption in Big Data Science and Biological Discovery. Big Data. 2013 Jun;1(2):85-99. doi: 10.1089/big.2012.0002. PMID: 27442063.
Heyen NB. From self-tracking to self-expertise: The production of self-related knowledge by doing personal science. Public Underst Sci. 2020 Feb;29(2):124-138. doi: 10.1177/0963662519888757. Epub 2019 Nov 28. PMID: 31778095; PMCID: PMC7323767.
Vogel J, Auinger A, Riedl R, Kindermann H, Helfert M, Ocenasek H. Digitally enhanced recovery: Investigating the use of digital self-tracking for monitoring leisure time physical activity of cardiovascular disease (CVD) patients undergoing cardiac rehabilitation. PLoS One. 2017 Oct 11;12(10):e0186261. doi: 10.1371/journal.pone.0186261. PMID: 29020079; PMCID: PMC5636132.
Neuringer, A. Self-Experimentation: A Call for Change. Behaviorism. Spring 1981: 79-94
