
By A. Christopher Wikman, March 2022
INTRODUCTION
Over the years, this weblog has brought to light, integrated and presented the science of aging and the healthy practices and interventions (see the post “PRACTICAL INTERVENTIONS FOR YOUNGING1.0 – Introduction to the series”), which can seemingly slow, halt and even reverse the aging process. Many readers have adopted such practices and interventions, and wonder the extent to which they are working, or whether some of them might not be working at all. This blog post reviews key biometrics, or biomarkers, associated with assessing healthy aging, which may help answer the reader’s question of “how am I doing?”
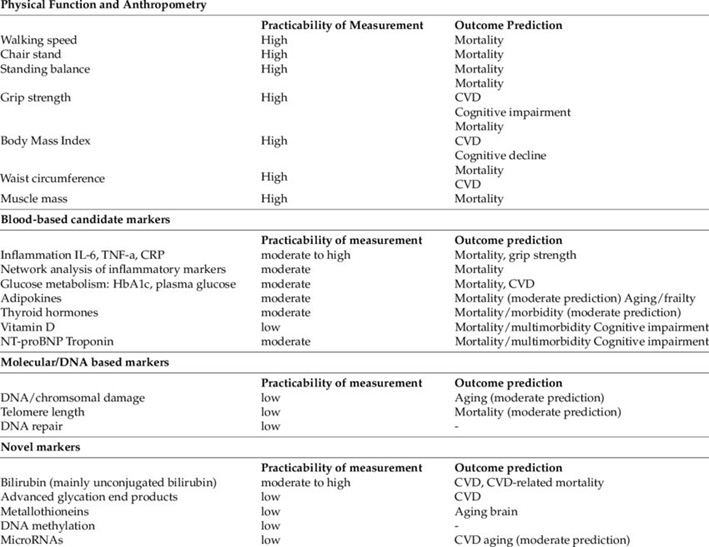
Table 1. Various individual biomarkers.
From Biomarkers of Aging: From Function to Molecular Biology, June 2016, Nutrients
Up until recent times, various measures have been predominantly utilized by medical professionals to assess patient health and diagnose illness. These range from non-invasive, traditional measures such as weight and blood pressure, to blood-based tests such as glucose levels, to complex imaging studies. The concept “Biological Age”, which has been in the literature since at least the 1980s (see Methods for the determination of psycho-social performance within the scope of a model for objectivizing biological age, Pöthig, et all, full article is in German), has arisen to use these measures, individually or in combination with others, to arrive at a proxy score in years which reflects healthy aging, or not, when compared to one’s chronological age, and now widely used in intervention studies. (This blog has previously covered some of these measures – see Telomere lengths, Part 2: Lifestyle, dietary, and other factors associated with telomere shortening and lengthening from 2010, and Aging, health and disease – view from the DNA Methylome from 2016.) We all know someone who seems to have aged slowly, or conversely, prematurely aged, due to various factors such as lifestyle and genetics. The best methods with which to determine Biological Age are an active area of research, and herein we will review some of the more prominent and interesting methods. To be useful as an aging biomarker, suggested criteria mentioned in the literature include 1) changes in levels of the biomarker indicate changes in aging and/or mortality risk, 2) they are reliable and repeatable, and 3) they can be affected by interventions.
Further, the research is looking at how well the measure can predict mortality and time-to death. Some earlier models, though apparently having strong predictive powers and correlation, were found not so strongly predictive of mortality risk.
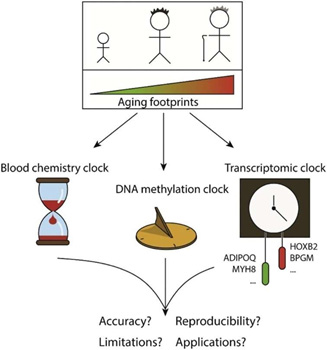
Figure 1. Telomere length, gene expression, blood chemical parameters and DNA-methylation status all undergo age-associated changes, which can be measured and used to predict chronological age with a varying error rate. From Biohorology and biomarkers of aging: Current state-of-the-art, challenges and opportunities.
Figure 2. This wonderful figure by Moskalev covers some of the complexity of this topic. See the reference to his book.
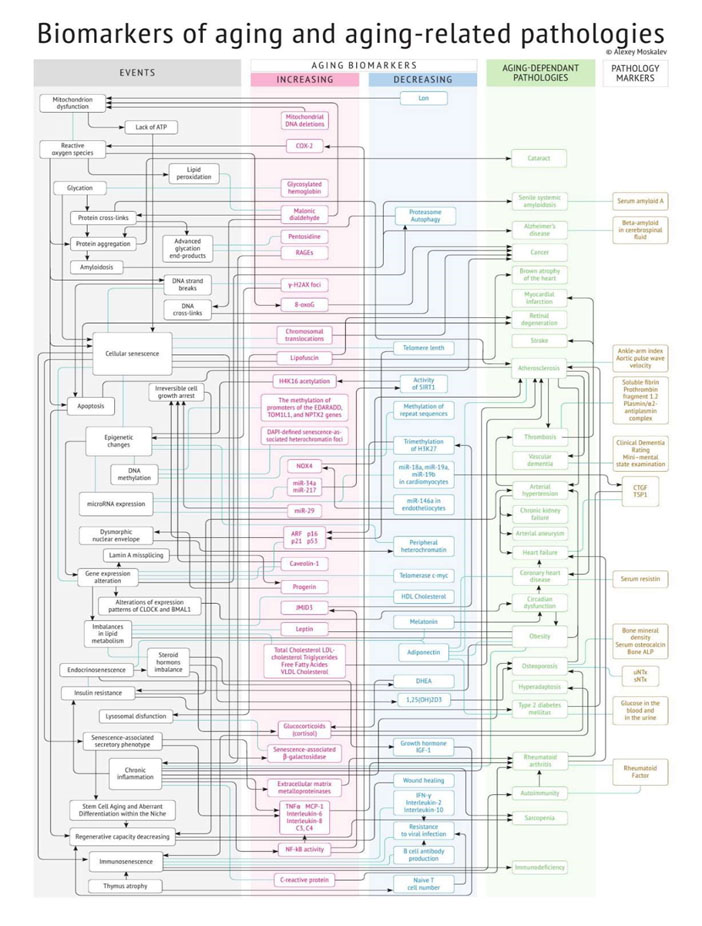
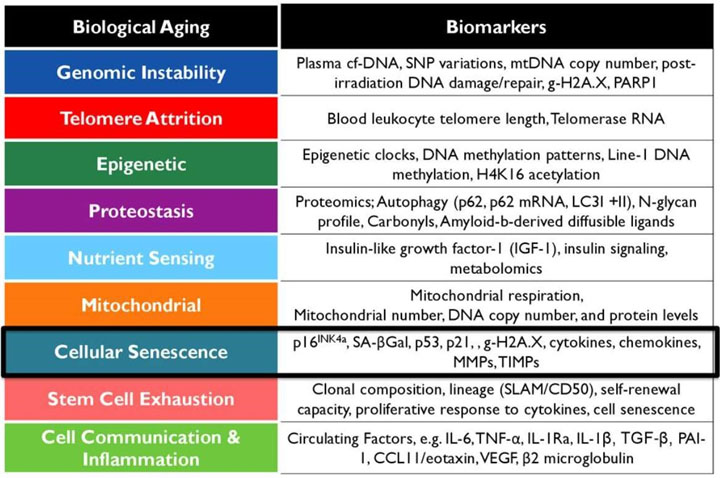
Table 2 – A selection of biomarkers associated with nine hallmarks of aging. Image source: A Framework for Biomarkers of Aging in Clinical Trials to Extend Healthy Lifespan Jamie N. Justice, PhD Wake Forest School of Medicine, Gerontology & Geriatric.
Before we delve into the more complex Biological Aging models, which are based upon multiple measures, we’ll cover the various types of individual measures which are commonly used to assess health, and notably those which are well correlated with aging (such as gait speed), but not those measures which may be elevated even in younger years, such as total cholesterol and graying hair, and thus are not as strongly correlated with age. For many of these aging indicators, there are published norms by age group, so patients may be able to assess their own results without requiring clinician support.
Also consider that measures can be looked at in at least these three ways: 1) the number of different assays required – how many things are being measured, 2) how is the measure being looked at – longitudinally vs. cross-sectionally (is one looking at how their own values are changing with time, or are they comparing the measure to aged matched norms – perhaps both?), and 3) the biological level of the measure, whether cell-based, organ-based, or patient whole-body level.
Physical performance measures
Gait speed is another term for walking speed, and is correlated with age (Association between walking speed and age in healthy, free-living individuals using mobile accelerometry–a cross-sectional study). Curiously, the study did not find a significant correlation between gait speed and Body Mass Index (BMI), though BMI has been used in several aging models. HW Jung in the study Functional Age Predicted by Electronic Short Physical Performance Battery Can Detect Frailty Status in Older Adults used gait speed, along with stand-up time and a balance score in a model to calculate a person’s functional age.
Grip strength is another often used measure to assess aging, wherein the patient squeezes a hand-held dynamometer. The results and applicability of this measure may be skewed if the patient has emphasized forearm resistance/strength training in relation to other healthy lifestyle factors, but otherwise is a significant factor in frailty.
VO2max is a measure of cardiovascular fitness and training – the amount of oxygen in liters per kg of body weight a person can utilize per minute of intense cardio exertion, typically steady state, over perhaps a 20 minute period (although there is an aspect of this which seems to slowly decline as the exertion continues). Various fitness devices, exercise equipment and their associated apps can provide an estimation, though more accurate values typically require a clinical setting. Calculated values range from the 10s and 20s for older, untrained individuals up to 80s and 90s for elite athletes. It is well known to decline with age, but can be significantly improved with cardio training.
Functional measures of physiology (other than physical performance)
Lung function is an intriguing measure. A follow-up review associated with the well-known Framingham study later found that lung capacity (or FVC – Forced Vital Capacity, in liters) was a better predictor of mortality than the well-known cardiovascular risk factors. Lung capacity decreases on average rather steadily beginning around 25-35 years old, and pulmonary issues are common in the elderly. (See the section below on Biological Age assessment for younger patients.) For years it was thought that this decline could not be significantly affected. However, freedivers and others have now shown this not to be true. Other relevant measures here are FEV1/FVC – FEV1 being the liters of air forcibly blown out in the first 1 second, and in relation to total lung capacity, and PEF – Peak Expiratory Flow, in liters of air/min. These are measured in a spirometry, commonly used by pulmonologists and allergists in the doctor’s office.
Interest in Heart Rate Variability (HRV) has been growing rapidly in recent years, further enhanced by the wide availability of wearable fitness devices such as the Oura ring, Apple watch, and Whoop wrist strap. This measure reflects the variation in time intervals between heartbeats, and a wider range of variation during a “data collection”, typically from 5 minutes to overnight monitoring, and at rest, generally indicates better, more adaptive autonomic response to stress. So higher values can indicate greater levels of health. After age 11-12, HRV typically declines with age (perhaps related to the onset of puberty) (see The effect of age and sex on the heart rate variability of healthy subjects). Blood pressure has long been established as a risk factor when elevated (or too low), and is used in some aging models. Resting heart rate, which is often lower than average in trained individuals, does not correlate well with age, and in fact seem to follow a U-shape in predicting all-cause mortality (The impact of time-updated resting heart rate on cause-specific mortality in a random middle-aged male population: a lifetime follow-up), with the lowest mortality risk found in the 60-70 bpm range. Cardiac output, which is the volume of blood being pumped per unit of time, also does not seem well correlated with age. Abnormally low or high values are more likely associated with disease.
Several neurocognitive measures are associated with aging, including memory and processing speed, and even physical measurements based on brain imaging. These have found their way into Biological Age models, but their use by patients would typically require physician support and be costly, and thus not easily accessible.
Anthropometric measures
Anthropometric measures are those which relate to measuring the human body, such as BMI, waist and hip circumferences, and waist-hip ratio. These measures generally increase with age after the 20s and 30s, though the correlation is not particularly as strong as other biomarkers we cover here, and as such, models to predict Biological Age based solely on these types of markers are not very useful. More complex body shape measures such as ABSI and SBSI, which reflect body surface area and may more accurately reflect unhealthy lifestyles, have found some application in models based upon deep learning sets.
Another external, non-invasive measure are the facial features related to aging, which have been used by apps to estimate one’s Biological Age. However, most of these apps seem not very useful, at least yet. Research using two different apps in the 2017-published study Age estimation by facial analysis based on applications available for smartphones found very poor performance for female subjects, while values for male subjects seemed somewhat better correlated with age. By 2018 however, the study PhotoAgeClock: deep learning algorithms for development of non-invasive visual biomarkers of aging claimed a MAE of 2.3 years, based upon eye corner images. Although not freely available, the plastic surgeon Dr. Richard Baxter offers a (licensed) PhotoAgeClock assessment to his patients. And while most app-based methods of predicting age are not very accurate, the perceived age of facial images (face-age) (as performed by human evaluators) is associated with all-cause mortality and other aging-associated traits. Note that facial aging does not generally correlate with epigenetic clocks or blood-based DNAm measures (Association of facial ageing with DNA methylation and epigenetic age predictions) – see more on this below.
Blood-based measures
There are numerous blood-based measures which correlate well with aging, and which are directly relevant to the hallmarks of aging (see Tables 2 above and 3 below). We will review some of these here, and then discuss some of the Biological Age models which are based on these measures. Further, we will focus mainly on those blood-based markers which are available in clinics or direct to the public, vs. those still in research settings only.
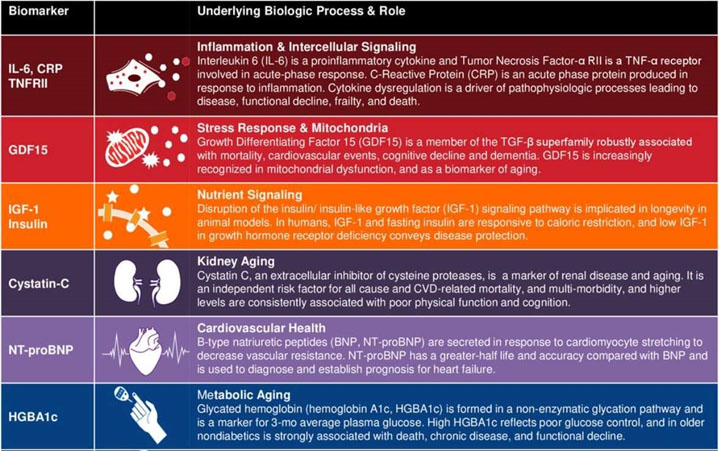
Table 3 – Blood-based markers and associated underlying biological processes. Image source: A Framework for Biomarkers of Aging in Clinical Trials to Extend Healthy Lifespan Jamie N. Justice, PhD Wake Forest School of Medicine, Gerontology & Geriatric.
Factors associated with red blood cells themselves include RDW (red blood cell distribution width) and MCV (mean corpuscular volume). Higher levels of RDW and MCV both correlate with aging, although these can also indicate disease such as a type of anemia. The PhenoAge model (see below), for example, makes use of these two measures.
The interest in telomere length as a predictor of aging has recently declined, somewhat due to the finding that it is weakly predictive of mortality and CVD. This measure is commonly obtained from white blood cells (but also from other types of cells), and reflects the amount of accumulated cell division, which is limited (see the Hayflick limit). It has been established though that not all cells, and organs, age at the same rate, and so telomere length based on white blood cells may not accurately reflect full body aging.
Reduced immune system function is another hallmark of aging. Relevant blood-based markers include WBC, CD8 and B-cell counts, which decline with age, lymphocyte % of total WBCs, and neutrophil counts, which increase. Clinically available direct measures of thymus health do not yet seem available. The thymus begins a life-long decrease in size after puberty, attributed to the decreasing levels of sex hormones.
Endocrine measures which are affected by aging (or vice versa?) include growth hormone, IGF-1 (part of the insulin-IGF-1-signaling system), and testosterone.
Systemic and chronic inflammation has been established as another hallmark of aging, leading to the term inflammaging. (This topic has been reviewed extensively in previous blog posts here.) CRP is a common marker for inflammation, and has found its way into several Biological Age models. Other markers not as common but also included in models include IL-15, IL-6 and TNF-α.
Cellular senescence occurs when otherwise healthy cells stop the normal cell cycle, and rather than dying off and being recycled as intended, they may release toxic substances which damage other healthy tissues. This is an active area of research, including the objective to identify relevant strong markers highly correlated with aging and mortality risk. IL-15, mentioned above, was found to be one of the stronger markers of senescence in the study The senescence-associated secretome as an indicator of age and medical risk, as well as GDF-15.
The growing awareness of and interest in anti-aging interventions has brought great interest in numerous natural substances previously either unknown or of low interest. Some of these can be assayed, and others implied by assaying related metabolites or pathways. Along with this has come patient interest in measuring one’s levels, which may be used to inform whether to supplement and with how much. Healthy levels of NAD, NMN, and NR, all related to vitamin B3, and the sirtuins, have been associated with anti-aging and popularized in best-selling books. Recently NAD assays have become available to the public, in the form of a home test kit which is returned to the lab for results, such as from the US-based Jinfiniti. The results provide a few very broad age-based ranges for what is “normal”. Other substances such as the hormone DHEA, the fatty acid GLA (which has anti-inflammatory properties), and the mineral lithium (in very low doses) have been associated with increasing longevity, and can be assayed by labs available to a doctor’s office, and in the US with increasing availability direct to the public.
Other measures include fasting glucose and triglycerides, which are elevated with age, and HDL, which declines. Interestingly, total cholesterol is not well correlated here, and some controversial but professional opinions have stated that better health is associated with higher levels of cholesterol, and that it is the combination of high cholesterol with the oxidation of the deposits which leads to cardiovascular disease. One may think of the analogy of high-speed driving combined with careless or reckless driving habits. In isolation, high speed driving can be safe under the right conditions, but it increases the risk of injury and mortality when coupled with other factors.
Aging markers of proteostasis (autophagy, UPR, folding and processing proteins, etc.) are still not well established. However, the common blood chemistry markers albumin and creatinine are correlated with aging and have found their way into models. Note that creatinine levels are affected by both external supplements (creatine), and by kidney disease.
Technological developments such as metabolomics, proteomics, etc. and AI techniques such as deep learning and deep neural networks (DNN) have enabled research to assay, analyze and determine the aging correlations of large sets of potential aging markers. Some of these measures are clinically available, such as albumin, leptin, PAI and cystatin C, while availability of others such as GDF-15 and B2M is either very limited (e.g. Mayo Clinic) or not at all.
Besides obtaining samples via blood draw, buccal swabs from the inside of the cheek can be used to obtain DNA samples for use in some of the various DNA methylation assessments (covered below), and urine samples have also been used in studies. Tissue biopsy and CSF draws are utilized in a research setting but are considered too expensive and invasive for widespread purposes at this time.
Geriatric-focused measures
Some biomarkers are focused on the middle-aged, elderly and geriatric populations. These include bone mineral density, hormones (such as DHEA and Testosterone), and frailty indices. As such, these measures may not be useful for assessing aging (as opposed to disease) until the ages of 60-65 and older. For example, in the study Age- and Gender-Specific Prevalence of Frailty and Its Outcomes in the Longevous Population: The Chinese Longitudinal Healthy Longevity Study, frailty incidence in the age group 65-79 was 4.8% (reaching 59% for those older than 100 years). So it seems unlikely that this measure would be useful for those much younger than 65 and generally healthy, due to limited population study data and very small distribution in the frail category. Unfortunately there is a younger population who suffer from chronic debilitating diseases in which those diseases are not strongly correlated with aging. For example, a Canadian 2017 study Prevalence of frailty in Canadians 18–79 years old in the Canadian Health Measures Survey found that 4.3% of all those aged 35-49 were already frail, with conditions ranging from liver disease, kidney disease, and asthma, among others. There exist other and specific measures for such diseases which are used to gauge disease severity, and these fall beyond the scope of this article.
Nonetheless, indicators for the category known as pre-frail may be helpful in identifying those at risk and for whom interventions can be utilized with the objective of delaying frailty. Which leads us to the next section….
Measuring aging in younger patients
The aging processes seem to take hold around 25-35 years of age. These processes include the onset of cardiovascular diseases, sarcopenia, neurological issues, and others. Given this, a key question is “how well can this be measured”, and further, does aging measured during one’s younger years accurately predict lifespan, and possibly healthspan. Can interventions be applied and be lastingly effective beginning at these “young” ages? Perhaps this will eventually lead to population-wide interventions beginning during these younger years and result in healthspans in the range of 100-120 years for the majority of the public, even assuming that we’re not yet able to extend lifespan beyond that range.
Consider that a single estimate of Biological Age is a point estimate. Lifestyle changes and interventions may take a few years to have a measurable or noticeable effect. Therefore, it may be useful to have a Biological Aging baseline established near the time one begins to make significant changes. A significant and ongoing longitudinal study (using data from the Dunedin Study) looks at the aspect of measuring aging in younger people over a long period of time. (See Quantification of biological aging in young adults (2015) and Disparities in the pace of biological aging among midlife adults of the same chronological age have implications for future frailty risk and policy (2021). Biomarkers from multiple systems were included – cardiovascular, metabolic, renal, this will eventually lead to population-wide interventions beginning during [the ages of 25-35 years old] and result in healthspans in the range of 100-120 years for the majority of the public immune, dental, and pulmonary (see Figures 3 and 4). Young adults were assessed at the ages of 26, 32, 38, and 45 years. As the authors had a data set which included the levels of many potential biomarkers over a 19-year period (and thus the changes in those levels), they developed a Pace of Aging for each member of the cohort. Note that the pace of changes in the model’s markers were generally non-linear. Larger values in Pace of Aging correlated with eventual and more significant changes in aging factors such as physical limitations, brain health, and facial appearance. So those with calculated higher rates of aging also looked and acted like they were older. A limitation of that study is that, being based upon a controlled age of the cohort, who were still only middle-aged, there was limited data on disability and mortality.
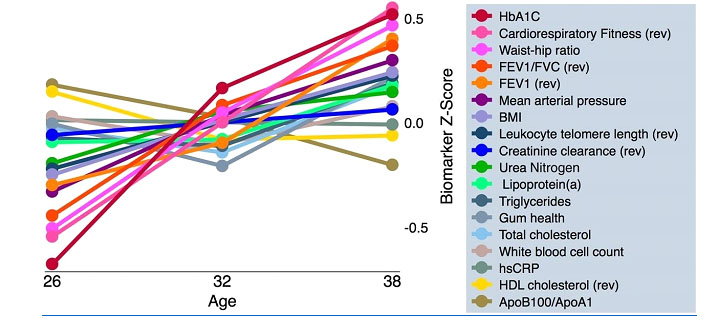
Figure 3 – Normalized measures and their trends from age 26 to 38, in the study Disparities in the pace of biological aging among midlife adults of the same chronological age have implications for future frailty risk and policy (2015)
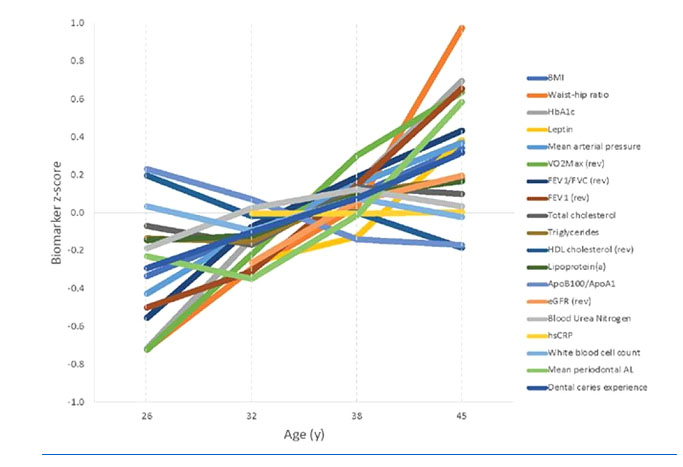
Figure 4 – Normalized measures (with some changes from earlier list) and their trends from age 26 to 45, in the follow-up study Disparities in the pace of biological aging among midlife adults of the same chronological age have implications for future frailty risk and policy, 2021
Younger readers may be interested to note that the study A new aging measure captures morbidity and mortality risk across diverse subpopulations from NHANES IV: A cohort study published in 2018 concluded that many aging measures, at least up to that time, overestimated the age of younger adults.
Biological Age models based upon combinations of measures and other information
A concern with most any single biomarker is that it typically reflects a limited aspect of the patient. Studies have found that various biomarkers which are correlated with aging often have low correlations between them individually. For example, an individual could have excellent triglyceride levels while having poor lung function. Taking either in isolation would probably not provide an accurate estimate of full-body biological age. The models reviewed below are based upon multiple measures which thus typically reflect more than one aspect of the patient’s condition.
Another possible concern is whether the indicator is applicable to a wide range of ages. A survey by the review Biohorology and biomarkers of aging: Current state-of-the-art, challenges and opportunities found that lower bounds among Biological Age models ranged from 0 to 46 years old, and upper bounds from 70 to 103. One would like a model which is able to predict age over a wide range.
The model RealAge projects your biological age based upon an extended series of questions generally about your lifestyle, illnesses, and a few blood test results such as cholesterol. The Q&A takes about 15-20 minutes, and is free after you register on the website. The prediction was found more accurate than chronological age (see Prediction of Mortality Using On-Line, Self-Reported Health Data: Empirical Test of the Realage Score). This may be one of the easiest or most accessible Biological Age predictors – however the accuracy depends upon self-reported data which is expected to be truthful.
VitalScan is an autonomic function test conducted in a doctor’s office, which takes about 15 minutes to conduct. The sensors used include blood pressure cuffs, oximeters, and EKG pads. This test also evaluates cardiometabolic risk, and generates a 15-20 page detailed physician’s report and a 2 page simplified summary for patients. One of the reported items is an equivalent age. As the test is somewhat focused, the predicted age must be understood in that limited context and not as accurate as models based upon a broader range of factors.
Similarly, the NeuPT-HRV scan can be used in a physicians’ or therapists’ office to evaluate a patient’s nervous system (presumably autonomic), focusing on HRV (see above), but also generates an extensive report, including predicted age.
Epigenetic clocks, based upon DNA methylation, were pioneered by Horvath and others, first published in 2013. Two which currently stand out are PhenoAge and GrimAge (see DNA methylation GrimAge strongly predicts lifespan and healthspan, Horvath, 2019). These tests are not available to the public at this time, but other variations are offered such as TruAge by TruDiagnostic, and myDNAge by Epimorphy, using lancet-based home blood draw kits and cost a few hundred dollars in the USA. TruDiagnostic now also offers a DunedinPACE pace of aging report (see more below on this). Another option is AgelessRx, which offers 4 different age prediction options across standard blood test results to DNA methylation, ranging from free to $495 in the USA.
There is by now a large variety of these epigenetic clocks, and further, there is a wide range in the number of CpG sites used in their models, ranging from 3 to over 1000, as shown in Figures 5 and 6. Curiously, there has been little overlap in the CpG sites used among the models, which would seem to suggest there is further work to be done to establish the “best” set of markers, or at least that perhaps there are multiple good solutions? (See more below.) Another area of study seeks to establish how a particular DNA methylation profile is linked to the root cause(s) of aging.
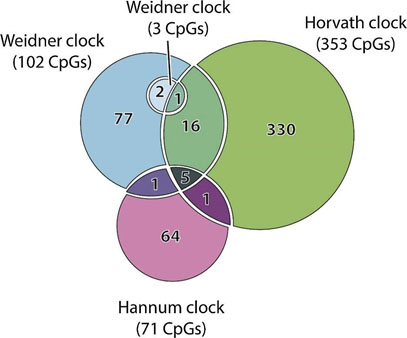
Figure 5 – Venn diagram of the CpG sites used in Hannum, Horvath and two Weidner clocks (all have <5 years of error […]. The intersection between their features is rather thin and indicates that DNAm clocks can achieve similar accuracy while relying on different sets of methylation sites. Source: Biohorology and biomarkers of aging: Current state-of-the-art, challenges and opportunities
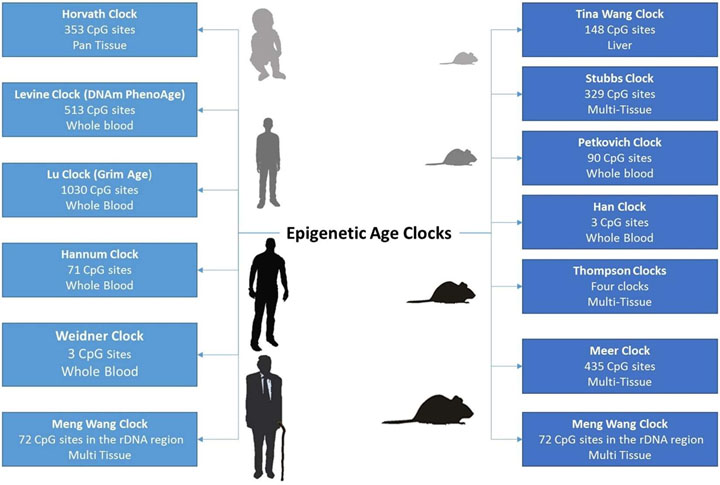
Figure 6 – Aspects of various epigenetic clocks
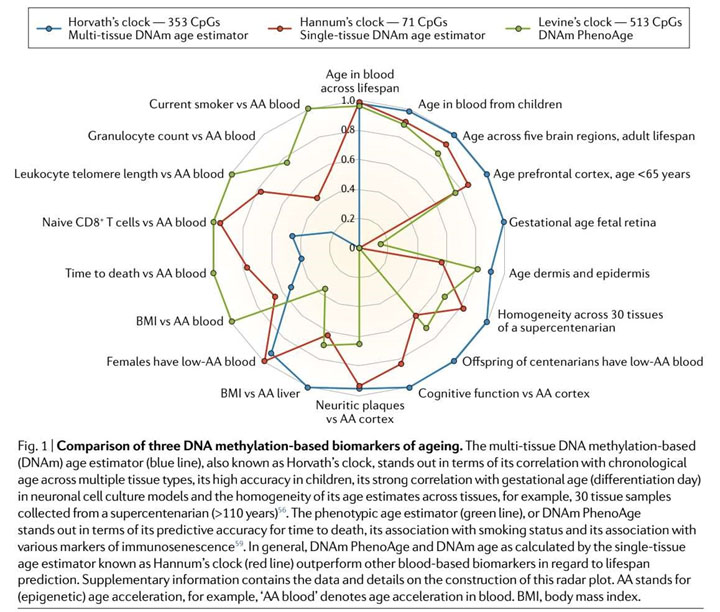
Figure 6 source: DNA Methylation Biomarkers in Aging and Age-Related Diseases – Another comparison of epigenetic clocks I.mage source (including imaged caption): The Institute of Regenerative Medicine: Biomarkers of Health and Aging: Is There a Paradigm Shift Coming in Their Measurements? (Author’s note: This diagram may have been originally sourced from a medical research paper).
Using blood test results often ordered by physicians such as for an annual physical, there are multiple websites, usually free of charge to use, which will generate a predicted age. Given the relative affordability of blood chemistry testing, availability of data sets, and accessibility, it’s interesting that these types of aging clocks did not appear until 2016. Aging.ai, offered by Insilico Medicine, has four variations which use 41, 33, 19, and 1066 inputs, and claims a mean average error of 5.5 to 6.2 years among the models. Several of the more commonly available blood chemistry markers mentioned above are used in their 19-input Aging.AI 3.0 model, as well as a few electrolyte and protein markers, geographical location and sex. This model was shown to be useful for assessing mortality risk in the study Population Specific Biomarkers of Human Aging: A Big Data Study Using South Korean, Canadian, and Eastern European Patient Populations.
Accuracy and repeatability of Biological Aging models – What’s the best?
The accuracy claims of various models seem to range from 3 to 6 years, with GrimAge currently considered the best available, with an MAE of about 3.6 years per Horvath. His team’s research concluded that GrimAge is 18% more accurate than chronological age. So GrimAge seems to be the best as of 2022. See the study DNA methylation GrimAge strongly predicts lifespan and healthspan, which concluded this model better than DNA Age and PhenoAge. Regarding repeatability, the Dunedin Pace of Aging studies noted continuously increasing predicted biological age, as expected. However, I am not yet aware of studies on the degree of repeated measures correlation in these clocks. Relevant to these models’ standard deviations or ranges of value, another likely question is how well do different models compare to each other. In this regard my personal experiences have shown a very wide range of predictions (see below). The 2017 paper Eleven Telomere, Epigenetic Clock, and Biomarker-Composite Quantifications of Biological Aging: Do They Measure the Same Thing? found little correlation among various DNAm, telomere, and biomarker-based aging clocks. The study also concluded that none of the clocks in the study were strongly associated with healthspan-related aspects such as balance, motor coordination, cognitive decline, and facial aging.
Alternately, the 2021 paper An integrative study of five biological clocks in somatic and mental health found small but still significant correlations between their epigenetic and transcriptomic clocks, and between their metabolomic and proteomic clocks (these two reflecting the inter-related inflammatory and metabolic issues), but little otherwise. The five clock models, epigenetic, telomere, proteomic, metabolomic, and transcriptomic, were new models developed for this study, and did not use pre-existing models. This study also points out that “Hastings et al., 2019 showed relatively strong correlations (r > 0.50) between three physiological composite biological clocks (i.e. homeostatic dysregulation, Klemer and Doubal’s method and Levine’s method), but not with telomere length”. The 2021 paper also looked at whether somatic and mental health issues were associated with aging. The proteomic clock age was associated with digestive and endocrine diseases, the metabolomics clock with cardiovascular disease, and metabolic syndrome associated with four of the five clocks. Mental health issues were picked up by the epigenetic and proteomic clocks and somewhat by the transcriptomic (RNA) clock. The epigenetic clock was effective at picking up the accumulated effects of cigarette smoking. Very curiously, the lifestyle factor physical activity, in mean MET minutes per week, was not associated with any of the five aging clocks. A sixth, composite clock was also developed by this team, combining the five others, and this model had stronger associations with disease and lifestyle factors. A conclusion was made that “…the correlates of chronological age in different molecular layers were not strongly correlated, suggesting that biological aging may be differently manifested at certain cellular levels”, and that “being biologically old at multiple cellular levels has a cumulative multi-systemic effect”. What’s not fully clear yet is whether and how aging precedes and is a risk factor for disease, and whether those aging aspects can be elucidated before middle age.
The 2020 paper Underlying features of epigenetic aging clocks in vivo and in vitro looked at 11 different existing epigenetic clocks and various sources for the DNAm samples. Not surprisingly, the clocks had overlaps but also significant differences. Five of the eleven clocks showed links between epigenetic aging and metabolism, immunity and autophagy. Two of the clocks showed links with cellular senescence and mitochondrial dysfunction. The team went on to extract features from each clock to create a meta-clock, which was highly correlated with aging across diverse tissues (better than any individual clock), better at predicting mortality risk, and better at capturing aging cell states. Unfortunately, as the team explained, they were unable to compare this meta-clock to GrimAge. Though since neither clock is available at this time to the general public, to many this will be a moot point.
So perhaps, while all aging clocks are correlated with aging, they may reflect different but partially overlapping areas. It seems likely that a “best” clock is going to need to reflect the aging of a large number of aspects. Nonetheless, aging clocks do reflect increasing risk of disease and death, and their development has been a major accomplishment.
There do not seem to be any single-sample biomarkers which are a reasonable predictor of whole-body biological age. However, this doesn’t mean they are to be ignored. I maintain a personal assessment chart of about 30 aspects of my health and physiology, which helps me focus on specific areas which may need improvement. For example, my lung function has been less than optimal, and by incorporating healthier breathing practices over the last year, my lungs’ functional age has improved by 5 years, much to the surprise of both myself and my physician. (Future articles will cover more on this.) One approach could be to concentrate on the markers related to the most prevalent diseases in old age and morbidity – cardiovascular, cancer, neurological (such as Alzheimer’s and Parkinson’s), diabetes, and chronic lower respiratory (such as bronchitis), and then closely watch the trends in these markers. These combined account for over two-thirds of disease after age 65, and much of this is already covered in annual physical checkups.
How often? Considering the utility and effectiveness timeframes of interventions
We’ll only touch briefly on this related topic here, but further thinking about the results of Biological Age estimates inevitably leads to the question of how quickly can interventions “move the needle”, and thus how much time to allow before obtaining a new estimate of aging.
The TRIIM study (Reversal of epigenetic aging and immunosenescent trends in humans) measured blood chemistry on average every two months for a 12 month period. Alternately, suggestions in the media are that DNA methylation changes may not become significant until 3 years or so have elapsed, and thus frequent testing is not warranted. To this point, one may think about the monthly or yearly variations in commonly ordered blood chemistry results. Some markers seem very stable, while others may vary significantly within the lab’s “normal” reference range. These variations can be due to many factors, such as time of day, season of the year, fasting or not, recent intake of supplements and meds, changes in the dosage of maintenance medications, assay kit used, etc. For those who require or have available several assay values within the timeframe of a single year, for example, and considering the above factors, a patient might consider averaging the values which they have available, and not “cherry-picking”.
BMI and similar measures can be somewhat quickly modified by diet and exercise, though it’s likely that the accumulated long term effects of having excess visceral fat cannot be quickly undone. So just because you may have recently lost weight doesn’t mean you should get checked to see if you’ve now become “younger”.
Functional and physical performance-based measures may change significantly in a matter of months due to exercise, therapies, and lifestyle changes. As mentioned above, I experienced a 5-year reduction in “lung age”, as measured in a spirometry, seemingly due to 5-6 months of practicing healthier breathing practices, such as nostril vs. mouth breathing. To put that into context, my prior results had been somewhat steadily increasing (getting worse) in 1-2 year increments over the prior 5-6 years, and the same spirometry system was being used. This is not to say that my biological age improved by 5 years, but at least this aspect, and an important one regarding mortality risk in future years, was now improved.
HRV is another measure which seemingly can be “quickly” improved through training and therapy, but again, this is one aspect of your autonomic nervous system, and thus, to the extent we yet understand, improving it does not (at least quickly) result in a “younger” full-body and mind. (Note – the relationship between interventions to improve HRV and the Cholinergic Anti-inflammatory Pathway (CAP), which can be triggered by stimulating the vagus nerve, part of the autonomic nervous system, is an area of interest.)
To wrap up this section, and which has been reviewed previously in this blog, the following interventions seem to have the most impact system-wide: exercise, selected natural supplements and some medications, pulsed electromagnetic fields, varoxia, therapeutic plasma exchange, and stem cell treatments. None of these appear to be quick fixes.
Personal experiences
I’ve obtained age predictions from telomere assays, Aging.ai, DNAge, RealAge, facial apps, and others. The variation in predicted ages has in some aspects been discouraging, ranging from almost 30 years younger to 10 years older. One of those on the older side was a facial aging app, which was quite surprising, as most new people whom I meet assume that I’m 10-20 years younger than I really am!
Further references
Biomarkers of Human Aging, 432 page book, edited by Alexey Moskalev, 2019
Biomarkers of Longevity – Analytical Report, 145 page PDF presentation, Aging Analytics Agency, 2019
=============================================
Note by Vince Giuliano. With this timely and relevant first blog entry, I welcome Chris Wikman as a researcher and writer for this blog. I expect Chris will offer important additional contributions as we seek to expand on the nature and scope of our YOUNGING01 hypothesis.

Pingback: Managing Your Health by Analyzing Your Personal Health and Fitness Data - AGINGSCIENCES™ - Anti-Aging Firewalls™AGINGSCIENCES™ – Anti-Aging Firewalls™