
By Vince Giuliano
This entry is different from any other published so far in this blog – it describes an original research experiment rather than characterizing a whole area of research or being an editorial.
This is the second blog entry related to electronic wearable devices capable of making personal behavioral and physical parameter measurements that bear on health and wellness and likely longevity. The first blog entry was Digital health – health and fitness wearables, apps and platforms – implications for assessing health and longevity interventions – Part 1 Flux in the market. It provides a snapshot view of one area of digital health – the rapidly changing landscape of consumer health and fitness wearables like smart watches, online and mobile health and wellness applications, and the associated emergence of software platforms that can integrate such applications together. I say snapshot because of the rapidity with which the market for these device is evolving.
This current blog entry reports on initial personal experience related to identifying what appear to be effective daily stress biomarkers that are derivable from measurements made by my Basis Peak smartwatch. I report here on the results of logging data measurable by the watch for 30 days, analyzing it, identifying what I believe are critical constitutional stress biomarkers, and confirming that values of those biomarkers indeed correlate well with known stress events I have gone through over a period of 30 days.
A third blog entry on this series, written by Jim Watson with my help, is on Heart Rate Variability, a well-established and well-studied constitutional stress biomarker different than the new ones that I propose and discuss here.
A fourth blog entry in this Wearables series goes into further detail on my experiences on how the stress biomarkers described here reflect stress events and health interventions in my life over a full 156 day period.
THE DESIRABILITY OF AN EASILY MEASURED CONSTITUTIONAL STRESS BIOMARKER
First of all, I reiterate why I think this research could be quite important.
The Part 1 blog entry describes a fantasy enjoyed by some health and longevity researchers including myself – the availability to ordinary people of constitutional stress biomarkers that will help us understand the effectiveness of the multiple interventions we are entertaining for maintaining health and active longevity.
As I said there, “Such an intervention could be a simple change in diet, exercise or sleep patterns, or consuming a new supplement or drug. Stress events could be of an emotional or traumatic nature or as simple as disruption of the normal sleep pattern. The desired biomarkers could conceivably provide easy and very accessible answers in a few days to very basic questions such as “Is my new approach (to a new pattern of exercise/taking a new supplement or drug, sleeping longer or differently/etc.) really working?” “Comparatively speaking, how well am doing now compared to before?” “What price am I paying for staying up drinking until 4 AM last night?” “How long will it take for me after returning from China to re-establish my normal circadian health patterns?” “What has been the health impact of my partying for several nights in a row over Christmas, drinking more than usual and eating large late meals?” Or “I have added a high intensity 8-minute segment to my daily exercise regimen, designed to send my heart rate above 125. What is this doing to me or for me?” This fantasy of being able to answer such questions with measured physiological data may well be realized through a powerful wave of developments in consumer electronics powered by billions of dollars in investment.”
Based on the limited observations reported in this current blog entry, I think that I have identified a couple of readily measurable and indicative day-to-day stress biomarkers of exactly the kind we have been looking for. These can be derived from measurements from a smartwatch, a Basis Peak in my specific case. No need for chest straps, electrodes and electrode gel required for heart rate variability measurements. On the one hand, this blog entry is about a highly personal exploration. On the other hand, it might also characterize stress biomarkers that can be measured and utilized by everybody. Only a much longer period of systematic study and tests by additional people will tell for sure.
Some background personal experience over the last year
Skeptics ask the question of “what good are the measurements made by health and fitness wearables anyway? What is their practical value? The skeptics point out that there has been a very high rate of abandonment of use of the first-generation trackers(ref). People have been discovering that they are not conveying useful new information after a while, and stop using them
I don’t have definitive answers to this question yet. I don’t think anyone has. Yet I remain excited about the question and am happy to report here on my personal experience with exciting new stress bioindicators.
The personal usefulness to me of my first the-generation health wearable, a FitBit One, has been providing me ongoing support and impetus for my daily exercise regimen. For about a year now, it has provided me a good approximation of the degree to which I have moved my body and calories expended, so that in late afternoons and evenings I have a good assessment of how much more exercise I need to fill in to meet my daily exercise quota. I have been looking to move 3.5 miles or more a day and burn at least 1750 calories. Some days I will go out on several shopping expeditions or engage in physical work such as mowing the lawn or raking leaves or shoveling snow, perhaps climbing 18 flights of stairs in the course of the day. On those days I will easily make the daily exercise quota just by what I have been doing. Other days, particularly ones when I have been sitting at the computer studying and writing, I have sought to make the quota by filling in exercise later in the day on the treadmill or possibly by swimming or other physical work around the house. The FitBit One measurements have been very useful to help me make those decisions. They let me know how much I had to fill in. And, the weekly comparisons have been useful to tell me whether I have been following my exercise intentions. And the FitBit scale measurements of weight and BMI have been helpful for letting me know if my eating is getting out of hand.
NEW MEASUREMENTS WITH THE BASIS PEAK
I have had the Basis Peak smartwatch for a little more than a month now and have been in the process of discovering what it is good for. The device provides very interesting records of activities and sleep. The device includes sensors for movement (an accelerometer), heart rate, skin and ambient temperature, and galvanic skin response (for measuring perspiration). It logs these measurements from my wrist 24-7 when it is not in its charging station. The following two diagrams illustrate a typical day’s activity record and sleep record
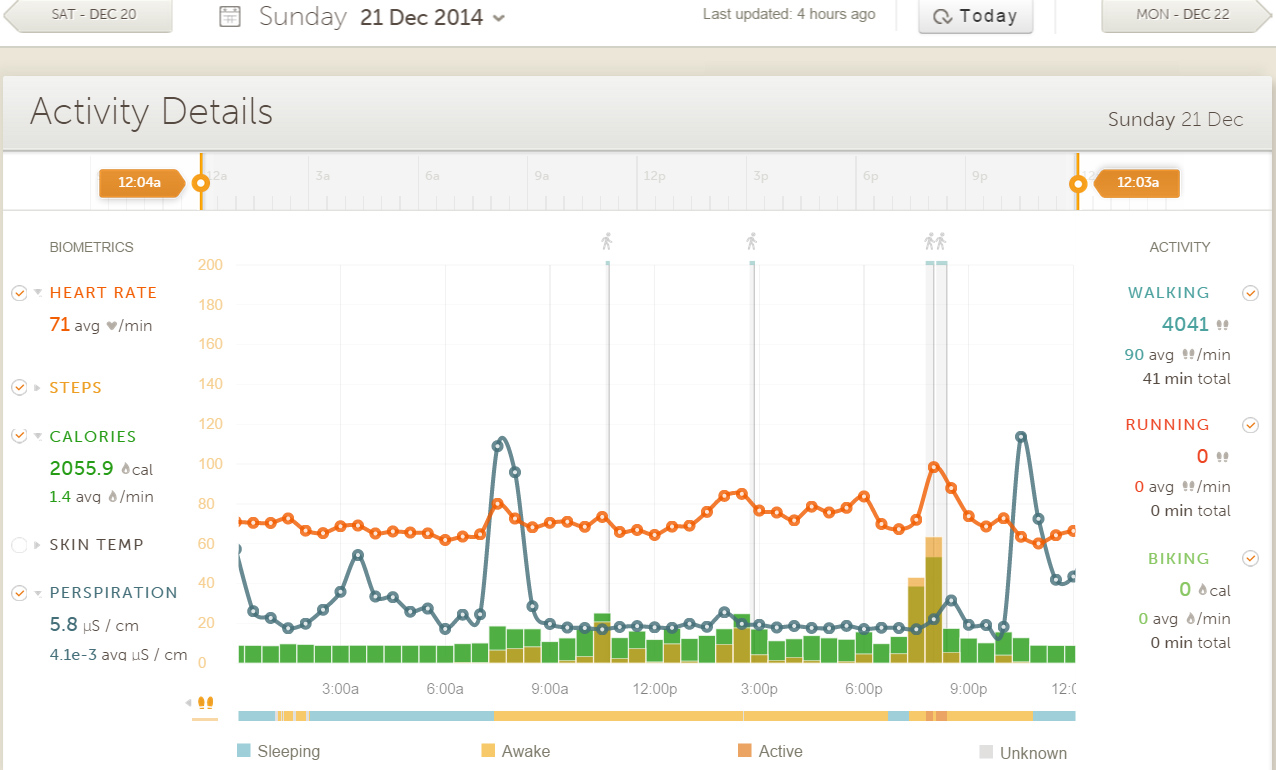
Taypical Basis Peak daily activity record
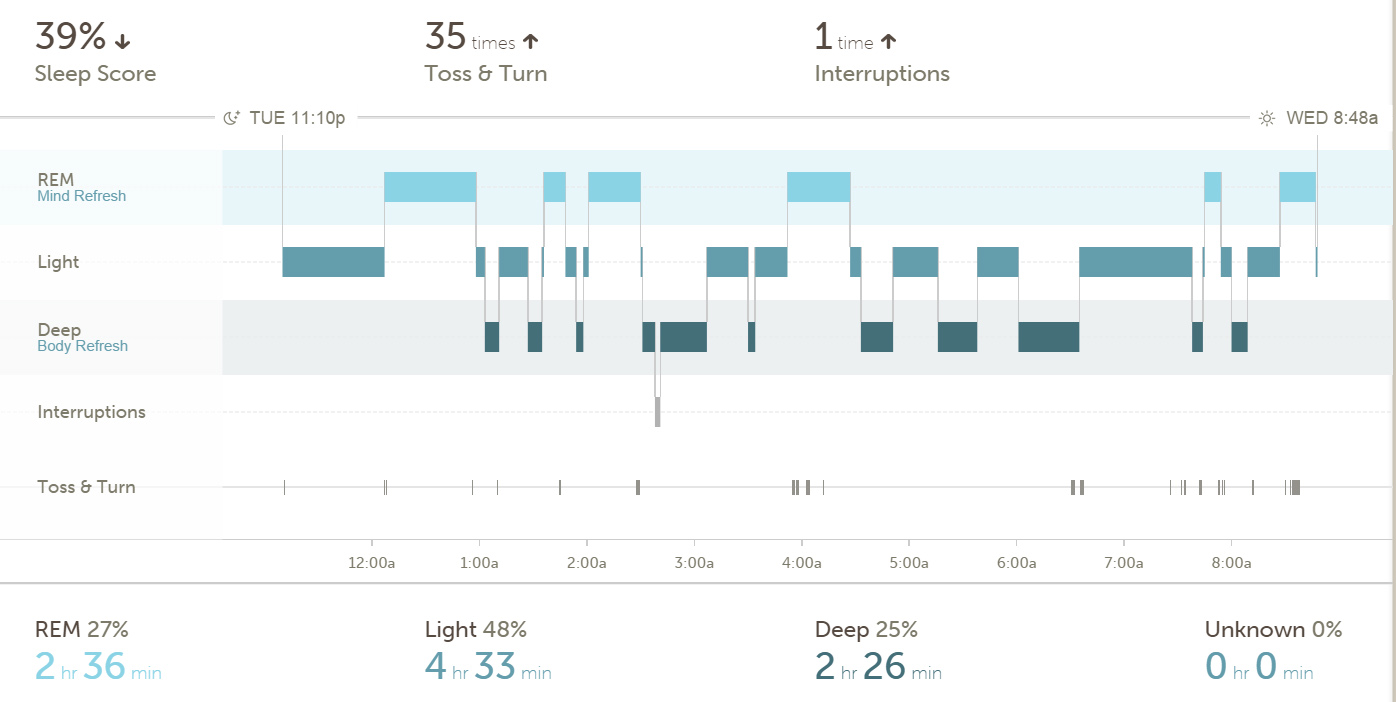
Typical daily Basis Peak sleep record
The Peak software is constantly recording, except when the watch is in its charging station – for about an hour every other day. New records like the above are produced every day and the historical ones are available online or on my smartphone. The Peak also produces a display that illustrates levels of daily activity by the hour for a week. That looks like this:
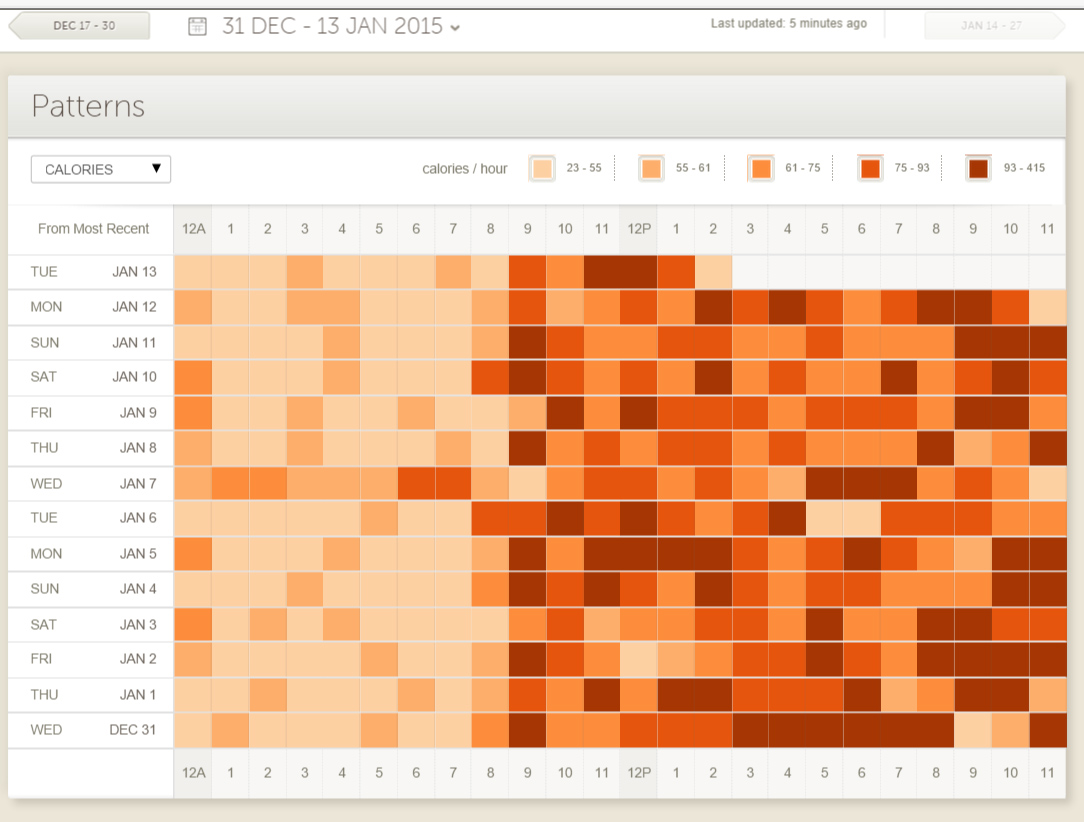
CHART A Activity during week
Depth of color represents level of activity in terms of calories burned per hour.. Note that January 7 was different than the other days; I comment later here on what happened that day..
DERIVING DAILY STRESS BIOMETRICS FROM DATA PROVIDED BY THE PEAK
Since receiving the watch, I have been very concerned about what useful biometrics might be based on this kind of data. Based on theory, actual measurements and correlating them with personal stress events as reported below, I am coming to believe that there are easily derived measurables that together can constitute indicators of daily and even hourly stress, and constitutional stress recovery capability. My confidence in this statement and excitement about this has continued to grow as I have tracked these measurables for 30 days now.
About resting heart rate RHR
Key to my observations are measurements of resting heart rate RHR (ref). RHR is normally taken to be an indicator of overall health, level of fitness and capability to handle stress(ref). The lower RHR the better, assuming there is no pathology or drug use effect. And lower RHR correlates with higher heart rate variability HRV, which is seen as another important measure of fitness and ability to handle stress. An objective of exercise training is to lower our RHR. Beats per minute (BPM) up in the 70s are too high, and possibly indicating a pathology if RHR is up in the 80s. RHR down in the 50s is good and in the 40s for trained athletes is even better. This chart rates RHR to fitness, from a sports and fitness science site Top End Sports
| Resting Heart Rate for MEN | ||||||
| Age | 18-25 | 26-35 | 36-45 | 46-55 | 56-65 | 65+ |
| Athlete | 49-55 | 49-54 | 50-56 | 50-57 | 51-56 | 50-55 |
| Excellent | 56-61 | 55-61 | 57-62 | 58-63 | 57-61 | 56-61 |
| Good | 62-65 | 62-65 | 63-66 | 64-67 | 62-67 | 62-65 |
| Above Average | 66-69 | 66-70 | 67-70 | 68-71 | 68-71 | 66-69 |
| Average | 70-73 | 71-74 | 71-75 | 72-76 | 72-75 | 70-73 |
| Below Average | 74-81 | 75-81 | 76-82 | 77-83 | 76-81 | 74-79 |
| Poor | 82+ | 82+ | 83+ | 84+ | 82+ | 80+ |
Note in this chart that RHR is not very sensitive to age but is quite sensitive to fitness condition.
However, RHR is not one thing: it varies day to day, according to the time of day and according to individual state of constitutional stress. Mine normally falls in the “excellent” range for people my age 56-61BPM. But some times when I am stressed it can be in the upper 60s. So, the normal advice is to measure RHR right after you wake up in the morning while you are still resting in bed. Still, it is not at all the same day-to-day. Worse, actual measurements with the Basis Peak indicates that there is an immense catch in that you can’t reliably measure RHR in that usual way described commonly in the literature. Again normally, RHR is supposed to be determined by measuring pulse immediately after you wake up before you get out of bed. According to my Basis Peak, that is like getting out your camera and photographing a lightning strike when you see one. There is no stability in heart rate during that interval according to the Peak. After waking up, heart rate instantly starts to spike upwards as does perspiration even before I am fully awake. By the time I could start taking my pulse, it is too late. So, if the Peak is measuring correctly, the conventional way of measuring RHR yields unreliable results. That is the bad news about RHR, but there is also seems to be some very good news.
The next observation is that over all the 30 days of measurement so far, that there are more or less stable plateaus of heart rates every night and every morning in which heart rate remains quite constant for at least an hour and a quarter. One plateau occurs shortly after sleep starts and the other plateau occurs just before sleep ends. These plateau intervals, according to the Peak are during sleep and only observable when awake by examining records. I call these;
ERHR for evening resting heart rate. In measuring this for a given evening, I access the Peak online records, take four measurements of heart rate during the just-after-going-to-sleep plateau, and average these. These are averages over about an hour and 15 minutes, and each Peak measurement included is also an average over a number of minutes. So, the values truly represent stable plateau values.
MRHR for morning resting heart rate. In measuring this for a given morning, I access the Peak online records, take four measurements of heart rate during the before-waking-up sleep plateau and average these. These are also averages over about an hour and 15 minutes, and each Peak measurement included is also an average over a number of minutes. So, the values again truly represent stable plateau values.
So, I believe MRHR gives me resting heart rate measurements that are more reliable than can be obtained the conventional way. But this is just the beginning of the good news. There are other interesting and consistent day-to-day observations.
Here are some of my current speculations.
- MRHR is a measure of how prepared the body is to deal with stress in the coming day, stress responsiveness. The lower the MRHR the more relaxed and refreshed the body is and prepared to deal with stress. This is based on the literature of what is normally called “resting heart rate.” As mentioned, MRHR is more accurately and consistently measured during the final stage of sleep instead of after waking when heart rate is no longer stable and invariably is spiking up.
- ERHR is a measure of the accumulated stress at the end of the day, accumulated constitutional stress, some of which may have been accumulated in the course of several days. The greater the ERHR, the greater is the need for sleep recuperation regeneration or other measures that restore stress responsiveness.
- The overnight ratio MRHR/ERHR is a measure of the degree of recuperation and regeneration in the body that has happened in the course of the period of sleep. The lower this ratio, the better. This ratio appears to be always less than 1 and averages about 90% for me over the 30 days of measurement,
- Another measurement of the degree of the overnight degree of recuperation and regeneration is the difference of the two beat rates ERFR-MRGR. The bigger, the better the restoration of stress response during sleep. This number appears to be always positive and ranges from near-zero for me to over 12BPM. Over the 30 days it averages 6.15BPM.
MRHR LEVELS AND ERHR-MRHR CORRELATE WELL WITH PERSONAL STRESS EVENTS I HAVE EXPERIENCED DURING THE PERIOD OF MEASUREMENT
Here in Chart B is a graph showing my MRHR and ERHR for the 30 days of measurements I have taken so far.
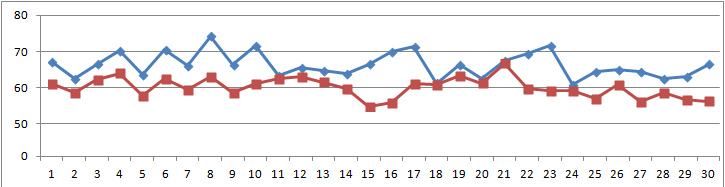 CHART B Blue is night-before ERHR and red is MRHR for the same night of sleep, in BPM.
Chart B graph is a good dynamic portrayal of the three measures MRHR, ERHR and ERHR-MRHR. The blue line shows ERHR, stress on going to sleep and the red line shows MRHR, stress the morning after just before waking up. The gap between the red line and the blue line is a measure of overnight stress recovery ERHR-MRHR. The bigger the gap for a given day between the two lines, the more the sleep-related stress reduction and the better. When the gap is tiny or vanishes, accumulated constitutional stress is not worked off very well by sleep.
Now, let’s look day-to-day at what is shown in Chart B as correlated with stress events in my life. To help you understand what is going on, I allow myself to relate some personal matters.
Up through day 10 I am living my life more or less regularly with regular sleeping and no special stress events. Then what happens on days 10-13? MRHR peaks and overnight sleep stress recuperation almost vanishes (as measured by ERHR-MRHR being very close to zero on day 11. There is a pretty good explanation. Days 11 and 12 are Christmas Eve and Christmas Day, times of irregular schedules, heavy late meals, multiple parties round-the-clock family events, birthday parties. a certain amount of drinking, and the emergency hospitalization of my first wife. I speculate that these stress events worked not only to raise MRHR but also to compromise night-time recovery of heart rate homeostasis over sleep
It appears that I have had very good stress recuperation starting on overnights 13-17. And the morning of the 15, MRHR was 54bpm, the lowest measured. Again, my life was getting back to regular and I was feeling good about things.
Note that on day 18 the gap ERHR – MRHR closed and stayed closed through day 21. What happened then, what stresses led to that? Here are some explanations: A possible factor affecting day 18 may be cold stress. Before retiring the night of the 18th, my wife, granddaughter and I were out walking in the bitter cold in downtown Boston for more than an hour and a half to see the First Night celebration events and fireworks, I was thoroughly chilled, Hoever, probably the key factor applicable during this period is nutritional stredss. I had a colonoscopy scheduled for day 21, so following the orders of my gastroenterologist, I literally had to start wrecking my gut biome on day 16. That is I had to go on a no-fiber diet featuring white bread, no fresh fruits or vegetables, no oatmeal, no nuts, and empty-carbs food and drinks. I also had to quit a couple of favorite supplements – Fish Oil Omega 3s and glucosamine. You can see how this and possibly the cold stress caught up with me by looking at what happened on Chart B on day 18. This is New Years Eve where the gap ERHR-MRHR nearly vanishes again as it did a week earlier. Yes dear reader, diet does have an immediate impact on stress responsiveness!, Without the butyrate and other good responses produced by the fiber-responsive gut bacteria, there goes my overnight stress reduction capabilities
That crummy situation persisted through to prepping for the colonoscopy procedure on the eve of day 21. The sleep on the night of the 20-21 was particularly bad due to being mostly awake running back and forth to the bathroom You can see that night was characterized by unusually high activity, by looking at the above weekly activity of Chart A for Wed Jan 7. Note from Chart A that I got up that day two hours earlier than normal that day to go to the hospital, and there was an hour of quiet starting at 9AM. That is when I was under anesthetic for the procedure in the hospital. You can see on Chart B that the accumulated impact on day 21 is that the stress indicator MRHR of 67bpm is the highest on record. And there was virtually no stress recovery ERHR-MRHR during the stressful night before.
You can see from Chart C below how my pattern of types of sleep started to go screwy the night of day 16 with no REM sleep then, and stayed screwy through the time of the colonoscopy on day 21.
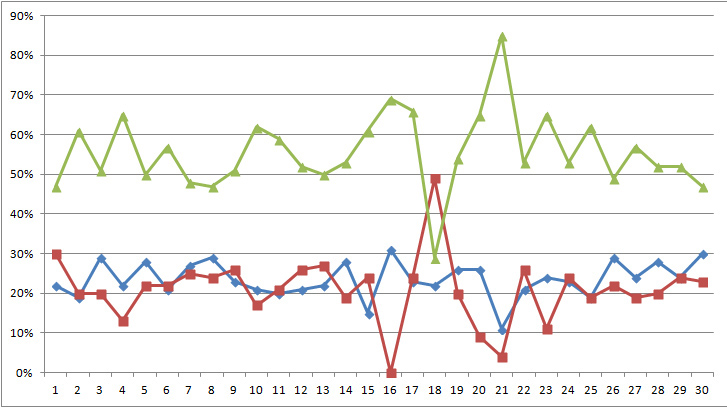
CHART C Green is light sleep, red is REM sleep and blue is deep sleep according to the Peak, all in percentages.
What happened on night 16 with no REM sleep? Perhaps it was the dawnin on me then that my first wife Lois would very soon die. We have always been good friends, we share two sons, and her family and mine share holidays and events together. She has been there in my life and part of my extended family for the last 65 years.
Going backto Chart B, days 22 and 23 show recovery of ERHR- MRHR and some but not complete recovery of MRHR. What happened then? After the colonoscopy I resumed a normal diet and had had a good 2 hour nap. That night’s sleep was long and sound with ample REM and deep sleep and you can see significant changes in the charts toward a normal pattern on day 22. MRHR/ERHR is back down to 86%. You also see normalization of the sleep chart type curves in the Chart C
The gap ERHR – MRHR Chart B for day 24 seems to be closed again, indicating no overnight stress recovery, and MRHR shows no recovery to previous lows. What happened then? Day 23 was a time of grief stress for me, with the funeral for Lois, ceremony, family wake events, and sharing of the loss with loved ones. That night I had horrible dreams. And body stress as measured by MRHR has still not recovered to the lower rates in the 50s before the colonoscopy
Days 25-30 show a steady trend to stress response recovery with slowly lowering MRHR, with Chart C showing declining oscillations between the different types of sleep. Day 25 shows (Chart B) improvement: the gap ERHR-MRHR starting to open up again and a little lessening of the stress as seen in MRHR. Day 26 of Chart B shows stress recovery ERHR-MRHR is there but not up to what it could be and stress level MRHR is stubbornly refusing to drop to its lower levels of before. Why is MRHR so slow in recovery to its possible low of 55?. I can think of two possible reasons: continuing sadness associated with Lois passing away, and a slow rate of recovery of my gut biome after the colonoscopy.
You can see days 26-30 reflect continuing normalization of all patterns to resemble those of days 1-10. The large oscillations in the different categories of sleep shown in Chart C are markedly less and it appears that the impact of the previous stress events is slowly vanishing.
In summary, looking at the timing of stress events in my life over the last 30 days and correlating these day-by-day with measurements, it indeed appears highly plausible that MRHR is a measure of how prepared my body has been to deal with stress in the coming day. And, that ERHR-MRHR is a measure of the overnight sleep-related degree of recuperation and regeneration in resting heart rate.
This is exciting for me because we have a long been searching for measurements of constitutional stress and measurements of stress-recovery capability. We are interested in these because we would like to know what our health interventions do, if anything. The measurements MRHR and ERHR-MRHR might provide part of the answer. In a next phase of this research as outlined below, now having established base-line measurements for me, I will be looking to see if some simple health interventions produce noticeable effects in these indices. I will also be researching heart rate variability HRV during this period and seeing how those measurements fit in. My gut feel is that we might be getting a handle on measuring constitutional stress and overnight stress recovery.
ABOUT HEART RATE VARIABILITY
I am proposing that MRHR/ERHR and ERFR-MRGR are measures of overnight sleep-related stress homeostasis recovery. This is new and fairly out-of-the-box. The usual approach for using cardio signaling to estimate constitutional stress homeostasis recovery is via measuring heart rate variability (HRV).
So I comment here on HRV. Heart rate variability (HRV) is generally acknowledged to be a good and well-studied measure of constituitive stress homeostasis recovery capability(ref). So if my proposal is correct, people with large HRV should show larger and/or more frequent values of ERFR-MRGR and recover from stress events more quickly. This idea is yet to be tested. I have just started personal HRV measurements, but do not yet fully understand how to interpret them. They are much more complex measurements than those described above.
HRV as a health index goes back to the ancient Greeks(ref) and there are 17,895 Pubmed research publications related to it. By contrast the measures proposed here are quite new. Use of these measurements were suggested to me by a reader comment in the Basis Peak blog about the sleeping heart rate plateaus, although as far as I know I am the first to formalize and systematically use them. Nonetheless at this moment I think they should be entertained. For one matter, given the current state of technology, the measurements proposed here can be more easily measured 24-7 than HRV. It is not now clear that HRV measurement can be accomplished by a smartwatch or wrist band. To measure it reliably appears to require wearing a special belt or electrode array and use of electrode gel. Also HRV is notoriously sensitive to the state of the individual, time of day, particular breathing patterns and other variables such as whether the individual is standing, sitting, or supine. Despite its very long history, HRV remains a controversial measurement. And comprehending it fully and understanding how to interpret it requires a level of expertise that lay people don’t possess. James P Watson has drafted a comprehensive blog entry on HRV and I am currently helping prepare that for publication. It will be appearing as Part 3 of this Wearables blog series very soon.
While the Basis Peak does not now measure HRV, it does contain sophisticated second- generation heart rate sensors and could possibly do so with proper software support. If so, this could possibly be an excellent direction for the Basis company to move toward.
BEYOND STRESS TO ASSESSING IMPACTS OF HEALTH INTERVENTIONS
The personal events reported here are stress events. I expect that the proposed stress measures MRHR and ERHR-MRHR will be equally valuable for showing constitutional state impacts for important health and longevity interventions. I intend to extend my program of deriving biomarkers from wearables and recording of correlated experiences. During the coming month or two, I expect continue my existing 30 day logging of Peak data and in addition::
- To periodically measure my blood pressure using a cuff and add this to tracked biomarkers
- To log pulse rate measurements using a sensitive sensor on a chest strap, a Polar H7, and alternative software to validate the Peak’s HR accuracy
- To measure and also log heart rate variability HRV using the same heart strap and Android-based software. I am currently using HRV Expert by Cardio Mood, sophisticated software created by a team in Moscow
- To see what correlations might exist between the stress-related indices reported here and HRV indices
- To look into alternative possible stress and other indices based on the collection of measurements made and known stress events and health interventions in my life, deriving inputs from the Basis Peak, the Polar Belt, my FitBit and possibly additional wearables
- To experiment with variations in my health and longevity interventions to see what impacts they will have on the indices. For example, I have started to modify my daily treadmill exercise regimen to include 7-minute segments with higher heart rates on different days, starting with instantaneous rates of115 BPM ramping up to over 130 BPM
- I may also experiment with stopping one or more of my longevity interventions for a period of a week to see what the stress consequences are
- To experiment with doing my treadmill exercises at different times of day to see what impacts timing of this may have
- To network actively with other people involved with stress monitoring via sharing experience and data. As of the moment I have started doing that with two colleagues
- To follow this blog entry up with others reporting more hypotheses and experience.
What exciting times we live in!

Pingback: Digital health – health and fitness wearables, apps and platforms – implications for assessing health and longevity interventions – Part 1 Flux in the market | AGING SCIENCES – Anti-Aging Firewalls
Readers:
Just a quick update to the previous update note . I have extended the logging reported in this blog entry for an additional 14 days now – to 44 days. There have been no major stress events in my life during this additional period since publishing the blog. The two stress-related measures described in this blog entry MRHR and ERHR-MRHR continue to behave as they should and my excitement about the reliability and possible utility of these measures continues to grow.
I have been intensely researching heart rate variability HRV for the next blog entry, and in the process have come across new insights for the meanings of MRHR and ERHR-MRHR, Basically, I see MRHR as a measure of parasympathetic nervous system homeostasis on awakening to a new day, the lower the better. I speculate MRHR is correlated with waking cortisol level. I see ERHR-MRHR as a measure of sleep-related recovery of parasympathetic nervous system homeostasis. Stress events and conditions including very poor sleep can raise MRHR and reduce ERHR-MRHR to nearly zero.
My current plan is to republish the blog entry after a full 60 days of data logging. In that republished version I will further discuss the insights just mentioned. providing literature citations.
Vince
Hi Comment and question.
Comment: I am reading a very interesting technical book by Stephen Porges titled “The Polyvagal Theory: Neurophysiological Foundations of Emotions, Attachments, Communication and Self Regulation”. Its a summary of Porges lifetime of work on the autonomic system. Chapter 4 specifically attempts to relate physiological stress to a measure of heart rate — heart rate variability. They have done some measurements and comparisons with experiment.
Question. Can you use the Basis Peak with a lap top or do you have to have an advanced cell phone?
Hi jhrose
We both seem to be exploring the same things recently, and I will look into Porges’ book. In a new blog entry with Jim Watson that will be published today or tomorrow, there will be much discussion of the foundations of HRV and dozens of citations,
As to your question, the Basis Peak will display its results on your iphone or Android device as well as providing complete records online on the web. Charts in the blog entry were from online. They plan to publish an API very soon that should allows you to export their raw data into any special app of your choice. I have found the device to be reliable and am very happy with it.
Vince
Pingback: Digital Health Part 4: Heart rate stress biomarkers derivable from smart watch data | AGINGSCIENCES™ – Anti-Aging Firewalls™
Pingback: A simple, comprehensive plan to prevent or reverse Alzheimer’s Disease and other neurodegenerative diseases – Part 1: The Plan | AGINGSCIENCES™ – Anti-Aging Firewalls™
Pingback: The top 21Benefits of Meditation | AGINGSCIENCES™ – Anti-Aging Firewalls™