
By Vince Giuliano
This blog entry focuses deeper on personal research I have been doing on specific constitutional stress biomarkers derivable from measurements by a smart watch, a Basic Peak in my case. I described the stress biomarkers and the first 30 days of experience with them in the January 2015 blog entry Digital health – health and fitness Wearables , Part 2: looking for practical stress biomarkers. As off the present date, a) I have more than 156 days of experience of measuring those biomarkers and correlating them with my personal stress events and stress interventions, b) With the assistance of Jim Watson, have further explored research related to the physiological events and processes underlying the biomarkers, and c) as a result, have significantly enhanced confidence that the biomarkers are meaningful, actually work, and are worth pursuing further.
In this blog entry a) I review what the stress biomarkers are and how they are derivable from measurements that are made automatically by certain smartwatches and other wearable devices, b) discuss how the biomarkers have behaved for me personally in the face of stress events and health interventions over the initial 146 days of measurement, and c) discuss why these measurements could be of significance from a health and longevity viewpoint for tens of millions of people who will soon be carrying Wearables that measure heart rate.
RECAP AND SUMMARY
For an individual, resting heart rate if measured under consistent conditions can be a good relative indicator of day-to-day and longer-term constitutional stress. However, heart rate is notoriously variable depending on recent activity history, instantaneous stress factors, and such considerations as what you ate recently and when, whether you are standing, sitting or lying down and whether somebody is hollering at you. It can vary by several beats per minute (BPM) in the course of a given minute. Measurement consistency can therefore best be achieved by measuring during sleep each day during similar segments in the sleep cycle. I use two biomarker indicators for resting heart rate: MRHR representing morning resting heart rate measured shortly before waking up, and evening resting heart rate ERHR which is measured shortly after falling asleep. These measurements can be based on data from a smart watch which has a good heart rate monitor and a capability of discerning when sleep takes place. During those particular times, heart rate tends to be relatively stable. I also use a third metric, which is the difference ERHR-MRHR for a given night of sleep. I hypothesize that MRHR is a good surrogate for my constitutional stress level for facing the world that I have upon waking up in a typical morning. I also hypothesize that ERHR-MRHR represents overnight stress response recovery during sleep.
Here, I report on how these metrics correspond to known stress situations as well as health and longevity interventions for me personally during 146 day period of initial observations. These time correlations between known stress and health interventions on the one hand and the stress biomarkers and the other hand tend to confirm my hypotheses as to the meanings of the biomarkers. They seem to work I conclude this blog entry with more general comments about how these biomarkers require further validation, and why they could turn out to be quite valuable.
The central purpose of this blog entry is reporting my personal empirical results. I have saved a further discussion of the science behind the measurements and additional complementary stress measurements for a subsequent Part 5 blog entry on Wearables and personal biomarkers.
WHAT ARE THE BIOMARKERS?
Heart rate, sleep and measurements
First, I comment on why the biomarkers must be based on measurements during sleep and exactly how they are computed. The Basis Peak you may recall detects sleep in three categories: REM, Deep Sleep and Light Sleep. The following chart shows my record for the evening of March 1
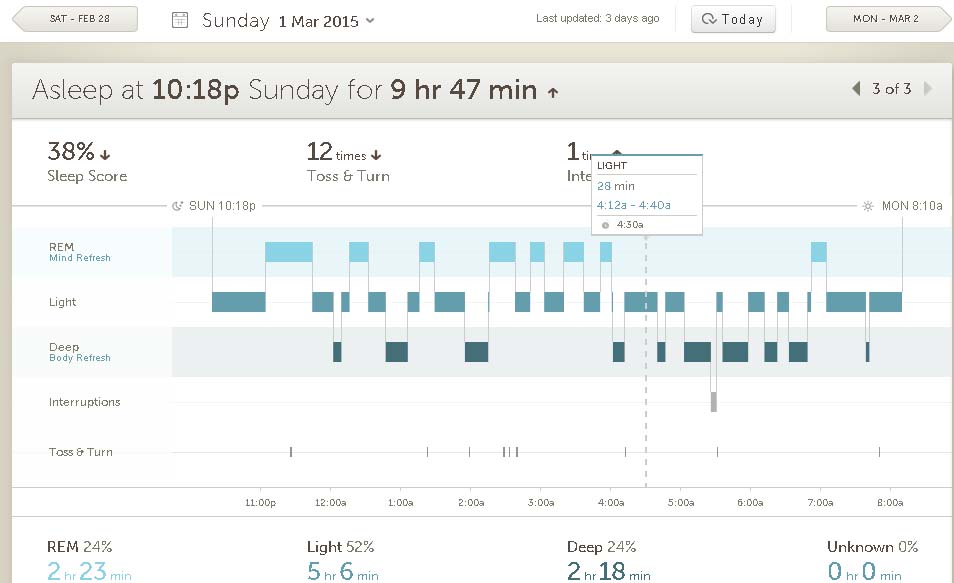
These numbers are all derived from overnight monitoring of my heart rate, skin temperature, skin conductivity and movement. The Sleep Score is a number computed by the Peak software which I note but do not use so far.
The Peak also produces activity displays for both night and day. Following are my daily activity displays for March 1 and March 2. The dotted red line shows heart rate with scale on the left as averaged about every 10 minutes, and the yellow line below shows being awake when yellow and sleep when blue. Tall orange bars show periods of treadmill exercise. I comment on some important recurring features, ones that show up on virtually all days.
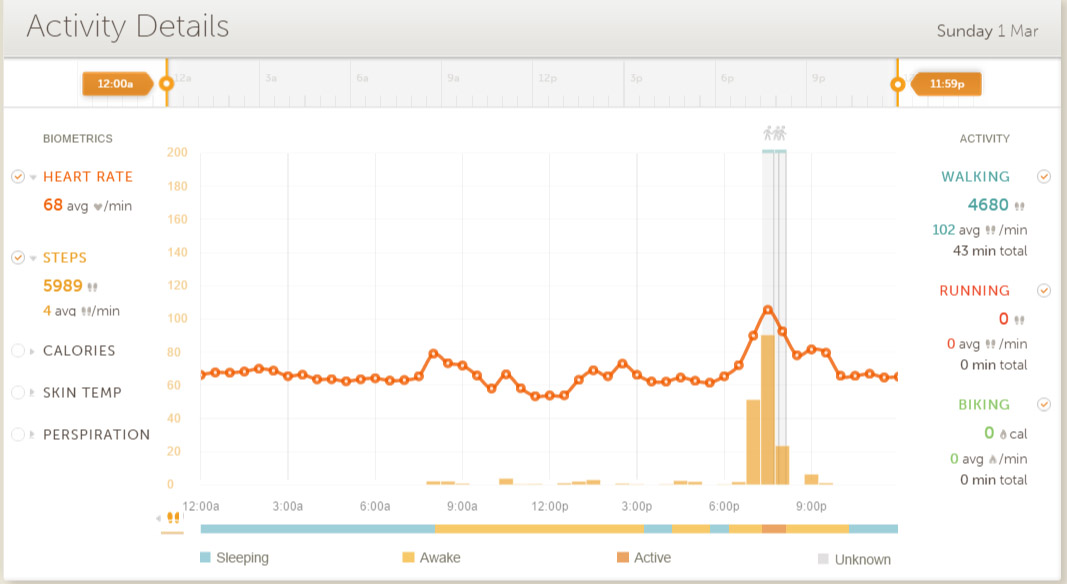
Chart 1, March 1 activity record
To the right on the March 1 chart looking above the blue sleep indicator below, you can see a rapid heart rate drop going to bed and just before going to sleep. This drop can range from 15 to 30BPM and corresponds to autonomic nervous system control balance being handed from the sympathetic system to the parasympathetic system. Such a drop is typical and shows up for every night of normal sleep.
The March 1 chart shows a plateau of heart rates that are fairly constant just after falling to sleep. This is also typical and the place where I measure ERHR. I take the average of the first four of these for the first hour of sleep to define ERHR. For March 1 these are 66, 66, 67 and 65 BPM for an average of 66 BPM.
Passing to the early morning of the March 2 activity chart below, paying attention to the blue sleep line below, you can see that the heart rate is quite constant while sleeping compared to its variations when awake. Again, this is very typical. During the nights there are periods of REM, deep and light sleep as shown for the night in question in the sleep chart above.
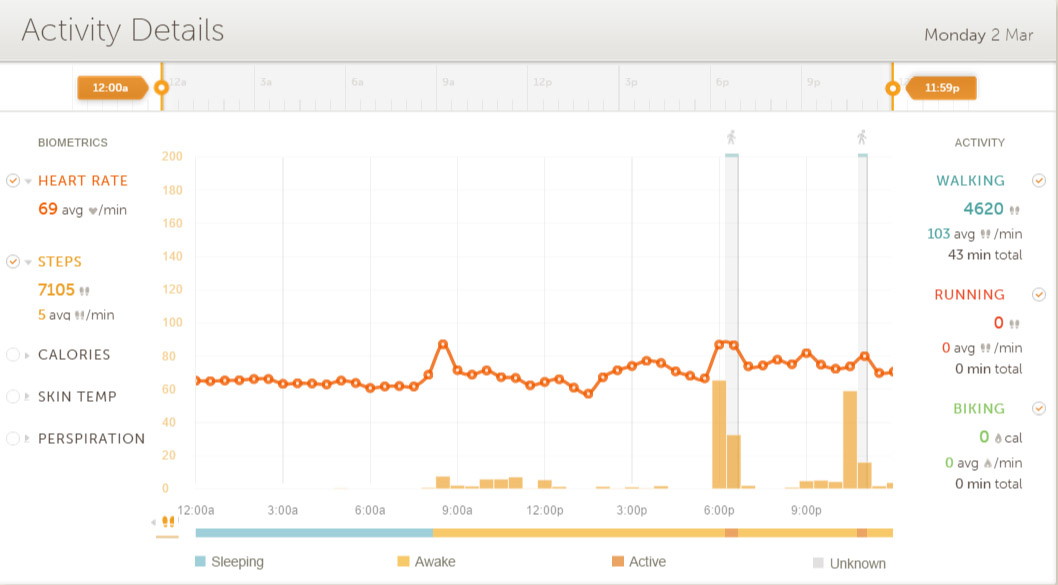
Chart 2 March 2 activity record
The March 2 chart shows a sleep plateau in the hour before waking up, also very typical and the basis for measuring MRHR. I take the average of the last 4 values before starting to wake up to define MRHR, in this case the average of 62, 62, 62 and 63 BPM or 62.25BPM for the morning of March 2.
Both charts show the heart rate spiking up again after awaking, again very typical. On the average HR spikes up 15-25BPM after awakening. So, you can see from the diagram that meaningfully stable heart rates that can reflect constitutional states can best be measured while asleep, not while awake. and not dropping or spiking up before or after sleeping. My Peak smartwatch gathers its most valuable information while I am sleeping. To my friends planning to put their apple watches on the charger daily while sleeping – you may be passing up your most relevant health-related heart rate measurements.
SSR = ERHR- MRHR (Overnight sleep-related stress readiness recovery) for the night in question is 66-62.25= 3.75BPM. This is a relatively low number, the average for me over the entire period being 6.86BPM. SSR is almost always positive ranging from 0 to 17. Only very rarely and in special situations does it go slightly negative – like during a night of being awake constantly going to the bathroom preparing for a colonoscopy the next morning,
Heart rate is constantly varying even during sleep, and not all plateaus are as nice and level as those illustrated above. For example, here is the 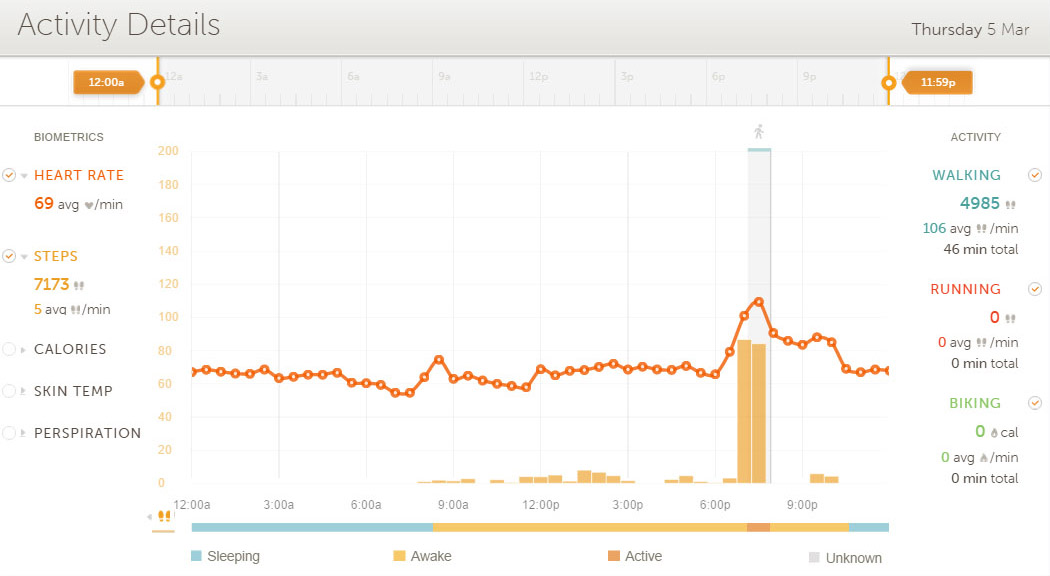 March 5 heart rate record during sleep:
Chart 3 March 5 activity record
The four scores averaged just before waking are 59, 59, 55. 55 BPM for a MRHR of 57. Some of the start-sleep and end-sleep plateaus are of this varying nature whereas the majority reflected internal variations of only one or two BPM.
The biomarkers are:
MRHR (Morning resting heart rate), which I assert is a good measurement of overall body stress readiness. I believe it is an indicator of the body’s ability to coordinate multiple systems (including cardiovascular, nervous, pulmonary and digestive) to handle stress situations and life situations in general. The lower MRHR the better. Again, this is defined as the average heart rate during what is generally a heart rate “plateau” that occurs in the morning during the hour just before waking up. Measured in beats per minute (BPM)
ERHR (Evening resting heart rate). The counterpart of MRHR after a day of activity, defined as the average heart rate during another heart rate “plateau” that occurs just after falling asleep.
SSR = ERHR- MRHR (Overnight sleep-related stress readiness recovery). Measures how much the multiple body systems that collectively determine heart rate have readjusted themselves during sleep to a lower heart rate, reflecting a lower rate of constitutional stress.
MRHR-RA, ERHR-RA and SSR-RA are 5 day rolling averages for each of the above, for the day concerned and for the four previous days. These measurements in part wash out day-to-day variations and are intended to make it easier to discern longer-term trends.
The units for each measurement ate beats per minute (BPM).
Importance of sleep and measurements
I need to emphasize that these measurements must be made while sleeping, so up until a few months ago they would have to be made wearing chest straps or in specifically-instrumented sleep-in environments like sleep labs. That is because as shown above heart rate almost invariably changes very rapidly just before going to sleep or just after waking up and it is virtually impossible to capture stable values during those times. Now a number of smart watches and related Wearables are capable of recording heart rates 24-7, detecting sleep by lack of motion as well as other parameters, and transmitting this information to the cloud where it can be analyzed. My experience reported here is based on using a Basis Peak smart watch which seems to capture the data well and display it coherently on my Android smartphone and online.
I need to point out that many of the generalizations I offer here are based on personal experience – N=1. I have good reasons to believe these generalizations are valid for everyone, but they require further experimental validation by a larger group of subjects.
146 DAYS OF EXPERIENCE WITH THE BIOMARKERS
Summary
I have computed the biomarkers on a daily basis, recording them along with a number of other baseline measurements provided by the Basic Peak on a spreadsheet I have been doing this on a continuing basis for 156 days now updating the spreadsheet daily and intend to continue doing so for a full year. I have also made note of what seem to be unusual stresses as well as changes in my health interventions. I have been paying attention to these biomarkers and what they mean on a daily basis. Both to assist me in my personal health decisions and help me evaluate the usefulness of the biomarkers. So much so, that my wife has described herself as “a Basis Peak widow.” Here, I report on what I did and on some of the main observations that can be derived from the data for the first 146 days, a period with cutoff date 10 days that allowed me to prepare the graphs for this blog entry.
Capture and analysis of the smart watch data
Here is a screenshot of a small segment of the spreadsheet showing the inputs and some of the derived measures for a randomly selected period, days 72 through 85 of measurement:
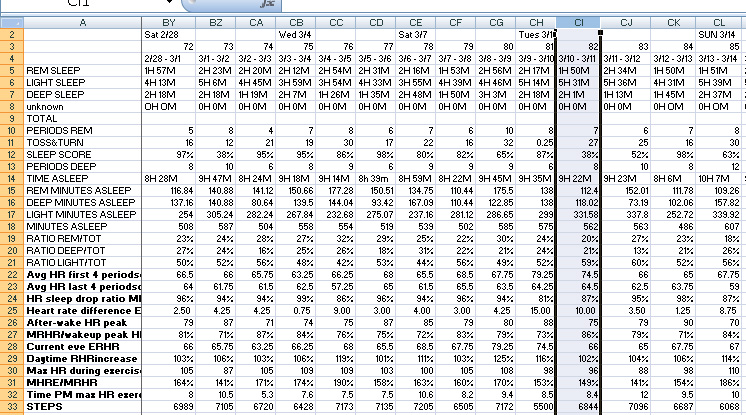
Chart 4: portion of spreadsheet
Rows 5 through 7 show hours and minutes of REM, light, and deep sleep for the preceding night as reported by the Peak. Reported time asleep is shown in row 14. Reported ratios of minutes asleep for the different categories of sleep are shown in rows 19 through 21, and corresponding minutes spent in the different categories of sleep are shown in rows 15 through 17. Rows 10 to 13 show other sleep data gathered by the Peak.
Row 22 shows MRHR for the evening of sleep before. This is manually computed based on the four values in the before-waking sleep heart rate plateau
Row 23 shows ERHR for the evening of sleep before. This is manually computed based on the four values in the after-going-to-sleep heart rate plateau.
Row 25 shows the derived measure SSR = ERHR- MRHR
Rows 26, 26,30 and 33 show additional daily data as reported by the Peak and the other rows at the bottom of the chart show derived measurements.
Additional rows of the spreadsheet for the same days can be seen here, showing more derived measurements:
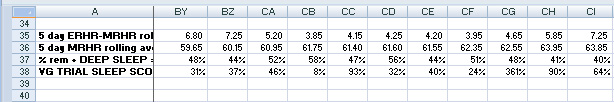
Chart 5: another part of spreadsheet
Row 35 shows backwards-looking 5 day rolling average SSR-RA = ERHR- MRHR, an important metric.
Row 36 shows backwards-looking 5 day rolling average MRHR-RA, also important.
The initial columns of the spreadsheet show average values over the entire period of measurement and standard deviations in those values.
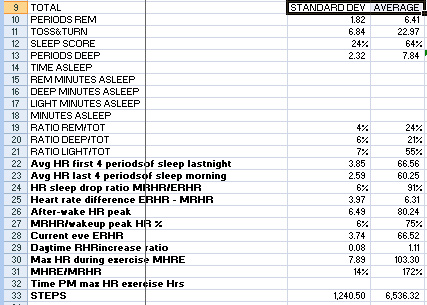
Chart 6: portion of spreadsheet showing averages for 146 days and standard deviations for the measurements.
Initial Overall observations
Over the entire period of observation, I have observed:
I believe these numbers are generally indicative of someone in a state of good health, as I believe myself to be. Later on, I explained how I see the large standard deviations to represent heart rate variability, also a good thing.
- All the numbers in the overall table have relatively large standard deviations for these day- to-day figures. This is not surprising for the heart rate measurements which may vary by several BPM from minute to minute let alone from day to day. Also, given the rather consistent lifestyle which I lead, it is interesting to see the relatively large standard deviations in the amounts of different kinds of sleep. The challenge, given this large variability, is to determine whether these measurements can produce useful insight. I believe the answer is yes.
- Over the entire period of observation, ERHR-MRHR was positive except in a very few special instances when it dropped to zero or even to slightly negative values. In those cases there is usually an explanation in terms of daytime events or disturbed nature of sleep. ERHR-MRHR tends to be largest when there is a good night of sleep not preceded by stressful events the day before. This is consistent with the notion that this measurement represents overnight recovery of ability to handle constitutional stress. However, it can depend on multiple factors reflecting a form of heart rate variability.
- There is a rich set of possible correlations among these measurements and I am still investigating some of them. For example there seems to be a strong negative correlation between ERHR-MRHR measured over a several day period and MRHR. That is, several days of strong overnight stress response recovery leads to a lower level of MRHR which means they lead to higher constitutional level of ability to handle stress. I am continuing to generate these measurements and likely will report additional observations in subsequent blog entries.
The biomarkers, stress events and health interventions
In the earlier blog entry on these measurements, I reported on the first 30 days of experience looking mainly at day to day variations in MRHR and ERHR-MRHR. Here, I focus on a somewhat longer term perspective. To see what is going on beyond the day-to-day variations, I have found it useful to wash those partially out, For this purpose I focus here on the five day rolling averages MRHR-RA, ERHR-RA and SSR-RA.
Here are charts for ERHR-MRHR -RA (top) and MRHR-RA (bottom), for the period of observation. Notice the number of days reported is 5 less than the total number of days of observation because the rolling average calculation only started on day five. So, day 1 on these charts is actually day 5 of actual measurements. 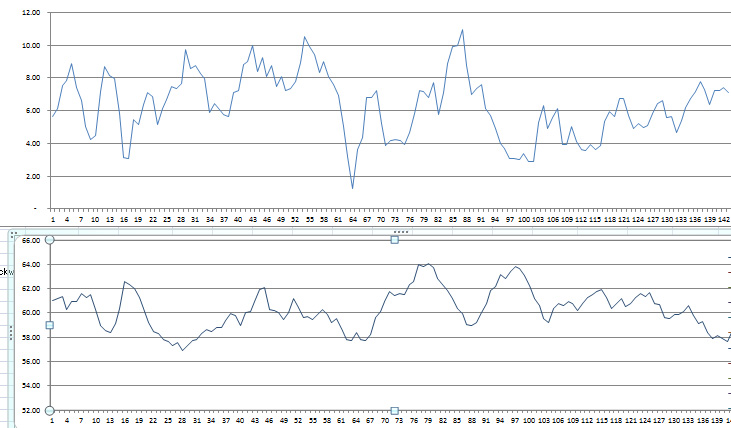
Chart 7: Rolling averages for overnight stress recovery as measured by ERHR-MRHR -RA (top chart) and general constitutional stress level as measured by MRHR -RA (bottom chart).
Both of the charts list rolling average values for the day of concern and the four previous dayA. They do not show the sharp peaks and valleys shown in the daily records. It is useful to mention what was going on for me during the various periods covered by these charts.
Stress scores during the first month of measurement
Days one through 26 as numbered above correspond to the first 30 days of measurement. I reported on the correlations between the biomarkers and a certain number of stress events in the prior blog entry where events during this interval are covered in more detail. Starting on about day 4, I experienced stress associated with Christmas and associated birthdays, a number of parties, disrupted sleep schedules, late meals, consuming alcohol and the like. This corresponds to the first dip in the top chart starting about day 5. The second and bigger dip in the top graph starting on about day 10 is associated with a colonoscopy leading to heart rate on the lower graph spiking up and maxing at about 62.5 on day 17. After that the top graph shows fairly good stress recovery took about day 28 accompanied with generally lower values of MRHR shown in the lower graph. The slight downward on the top graph shown on about day 20 corresponds to mourning associated with the death of my first wife and the start upwards of the lower graph from day 28 to where it peaks on day 45. Paradoxically this interval was one of the relatively high ERHR-MRHR -RA but still rising MRHR.
Stress scores and a West Coast trip
The sharp downwards spike in the top chart bottoming on day 64 corresponds to a trip to LA with disturbed circadian sleep timing, a strange uncomfortable bed and poor sleep, large late meals and active stressful days. Overnight stress response recovery went way down. This trip started out when my MRHR-measured state MMMmmstate of stress as shown on the lower chart was fortunately low – about 58 BPM. That is, I was prepared to handle the extra stress. So I did not get sick as sometimes happened to me in the course of similar trips in past years. However as you can see from the lower chart my MRHR trended up from about day 66 to day 81 in response to the accumulated stress, from around 58BPM to 62 BPM.
The scores and an NMN intervention
Around day 74 I realized I did not feel in a good energy state and I was unsatisfied with the relatively poor and worsening MRHR scores I was showing. So I decided to pursue a temporary health intervention, which is to start consuming a limited supply of a NAD solution which was gifted to me when I was in LA. I started consuming NMN in a liquid solution at the rate of about 1.2mg every morning. This seemed at first to work very well. I felt much better in a few days and you can see in the top chart that ERHR-MRHR –RA was great and shot up to over 10 by day 89 and MRHR improved during the same period, dropping to about 59. I felt great by then, alert, super-productive, and capable of taking on serious new challenges. (Faster than a speeding lawnmower and capable of jumping over large doghouses.) But then the party seemed to end. Between days 89 and 98, ERHR-MRHR –RA had crashed down from daily scores of over 10 BPM to scores of 3.5 BPM. And as shown in the lower chart, MRHR was back up to 62 BPM again. And this happened while I was continuing to supplement with NMN. In fact I continued to supplement with NMN until my supply ran out on day 114. But beyond day 98 it seemed to make no difference whatever.
What happened in this period? Jim Watson had seen a similar pattern of improving and then worsening stress and biomarker scores (using a panel of conventional blood biomarkers, not these biomarkers) in someone else who was taking NMN. They improved for a short period and then came back to where they started – despite continuation of NMN supplementation at a considerably higher level than I was doing. Our tentative conclusion is that NMN supplementation as a general health intervention did not work because of body feedback inhibition loops related to NAD+ and SIRT1 which take a couple of weeks to kick in but then restore metabolic homeostasis to what it was before the intervention. Probably it is a re-tuning of the NAD salvage cycle. If this result is generalizable it could be highly relevant for the researchers and commercial companies setting out to enhance NAD+ levels by supplementation with NMN or NR. See the extensive discussion in the recent blog entries in the series related to an NAD+ Part 1, Part 2, and Part 3.
Final period – systematic attention to sleep, diet and exercise and regular consumption of a liposomal anti-inflammatory preparation
Around day 98 it was evident to me that the NMN was not a panacea, and I had to emphasize other known health interventions if I wanted to experience consistently feeling good and consistent high work energy and productivity. Remember, I will be 86 in November so my needs for maintaining full health and functionality are more extensive than those of a normal 55 year-old. I think of myself as being like an ancient Mercedes car – capable of working very well but requiring careful and consistent attention to preventative maintenance. I saw these measurements as somewhat more refined than a “check engine” light but performing a somewhat similar function. For the first time I set goals of consistent values of ERHR-MRHR -RA (over 5.5 BPM and consistent values of MRHR of less than 60 BPM. Among the things I decided to do are:
- Pay a lot more attention to sleep, establishing a consistent bedtime, avoiding early awakenings when possible, allowing plenty of time
- Avoid late or heavy meals, drinking more than a small glass of wine at dinner, and avoiding sweet deserts
- Avoid stimulants like coffee or chocolate afternoons or evenings
- Start regular twice-a-day consumption of 4H-Lipo, an experimental liposomal preparation of four powerful anti-inflammatory herbs. My colleagues and I had been making and I had been consuming this substance for over a year – another important story to be told in a different blog entry. The key point is that only at this point in history did I start religiously taking a heaping teaspoon-full of it twice instead of once a day.
- More careful monitoring and fill-in of exercise. I have been monitoring steps for over a year, at first with my FitBit and later with my Peak smartwatch. My daily goal is a minimum of 6,200 steps per day – about 3 miles of walking. I became more rigorous of filling in exercise on the treadmill in the early evening to consistently meet this goal.
- Respecting a balanced lifestyle and allocation of personal energies. I remain tremendously excited by my research related to this blog and two new longevity related research projects started only recently. (One of these is the anti-inflammatory liposome 4H-Lipo project referred to above; the other is the Wearables measurement project reported in this and previous blog entries.) It is easy for me to immerse myself in this work and there is always much more to do in a given day then there is time for. So, I can lose perspective as to the other important priorities in my life: being with other members of my large family and attending to constantly emerging needs of family members, leading a rich social life, handling financial issues, maintaining the infrastructure of my large house, keeping a half-dozen computers working well, and for half the year maintaining a summerhouse in New Hampshire. While I focus intellectually on my personal needs for health and write about them as I am doing now, I could give short shrift to things I need to do such as get up from the computer and move around every hour or so.
- Continuing experimental innovating with health interventions. For example, up to this point I have not tried regular meditating, but plan to.
While I have striven to respect these and similar intentions with a little more focus since about day 98, I have not been strict in doing so. For example, I was willing to consume some cake and ice cream at my grandson’s birthday party and occasionally have been out for a late evening. Nonetheless, you can see that the general trend of ERHR-MRHR -RA has been upwards from day 98 to day 142, going from 3.5 BPM to about eight BPM, and the general trend of MRHR -RA has been downward from day 13 to day 142 from about 62 BPM to 58 BPM, so the above resolutions seem generally to be working. During this period, I should mention, I have experience some minor stresses corresponding to the minor valleys in ERHR-MRHR -RA, but no major stresses. It will be interesting to see as time progresses whether I can maintain levels of MRHR -RA significantly below 60 BPM. My next stress intervention will be an experimental program of mindful meditation. My cutoff dates for the charts in this blog entry was day 146, e but now on the day of publication, I have gathered 156 days of data and my MRHR -RA has remained below 60 since day 135. It now stands at 56.5.
My personal observations as reported in the previous blog entry and here support the hypotheses that for both day-to-day and longer term periods, ERHR-MRHR and MRHHR indeed are useful constitutional stress measurements that actually reflect the effects of known stresses and major health interventions.
I expect to carry out this measurement process for a full year and examine the possible impacts of a number of additional health interventions.
Again, at this point this hypothesis is based on observational correlations as well as on a body of theory related to heart rate measurements. Other events may have played important roles as well. Also the data is only for one person up to this point, myself. I believe it will be worthwhile for others to conduct similar measurements for themselves, however. For this purpose I invite my readers to check out these biomarkers for themselves and share their data with me. I am willing to provide interested parties with a template for the spreadsheet I have been using. Please write me if you would like such.
DISCUSSION
Applications of the biomarkers
Here is a few basic of questions that I believe the suggested biomarkers can help answer
- How stressed out am I? –basically as a a guide to action decisions? I want to push myself but not go over the edge so I get sick. That is, given my state can I safely take on a new basic stress — like a very long mountain hike in the cold, or an elective surgical operation or a quick-turnaround trip to China. Should I go ahead with my planned trip to St Paul tomorrow morning to talk to the Kiwanis Club, given that I have a slight sore throat and I have to take a 4:30 AM plane? Should I take on such a new stress or would it be better for me to take it easy for a while? I think a low MRHR-RA (60BPM or less for me over a several day previous.) shows low stress and a high SSR-RA (8BPM or more for me) shows strong stress recovery capability and ability to handle a stress without getting sick. On the other hand, MRHR-RA of 64BPM or more and/or SSR-RA of 3 or less will lead me to postpone the stress if I can. — In my 156 days of measurement experience, these RA measurements show strong patterns of variation. They also tend to correlate well with how well and raring-to-go or how crummy I feel. I am gradually developing trust in the measurements for these kinds of questions and action decisions.
- Is a new health intervention I am pursuing actually doing anything? And. what would be the impact of discontinuing an existing health intervention or pattern? Possibilities are multifold including adapting any of countless diets, changing my exercise pattern or the forms of exercise, altering my sleep rhythms or altering timing of meals, or meditating. And how about taking on a stressful new activity because of expected hormetic health benefits, like systematically exposing myself to cold? I could sniff hydrogen sulfide or carbon monoxide. On the other hand, I could quit doing something. I have been consuming a large number of different dietary supplements at quite considerable cost. Could I save money by discontinuing some of these? And if so, which ones are superfluous? — I have been looking to the longer-term –MRHR-RA and SSR-RA measures to address such questions as these.
- How bad are the consequences of specific stress events? Here is where the bioindicators definitely seem to work well. As a busy professional sometimes I have to do things like fly back from California on overnight “red eye” flights or attend late-evening dinners, on occasion get only 3-4 hours sleep at night. I participate in many socially-expected behaviors I know are not good for me such as going to late parties, drinking to many gin and tonics, consuming big heavy meals late at night or eating cake and ice cream at a family birthday parties, and missing regular exercise for a day or two during travel or intense periods of work activity. Such events definitely tend to be reflected in my daily MRHR and SSR measurements as you can see from the readings I have described below, and often it may take several days to recover from them.
Personal instrumentation – practical importance of the personal stress biomarkers biomarkers
The basic issue of concern here is personal health instrumentation. How comfortable would you be flying in a plane which you knew had no flight instruments? No way? That is what we have been doing with our day-to-day health. In the earliest days of aviation, airplanes had no instruments, You flew strictly by “feel,” feel of how smoothly the engine is running, whether the plane was flying level, feel for where you are even though you can’t see the land below due to cloud cover. Further, feel for what is happening with the weather, feel for what is left of your fuel supply, feel for whether your flight controls like your wing and tail tabs are working well. That is largely how we run our health today – by feel. I have an emotional crises or a surgical procedure and get little sleep. How do I feel the next day, the next week? I take a new supplement that is supposed to reduce my inflammatory status. How do I feel the next day, the next week? Is my pain less? My medical blood tests like the cholesterol levels and CRP and X-rays provide valuable data feedback, but these are periodic or event-driven and offer me no clues to day-to-day responses to day-to-day events.
In fact, I think such personal feelings about health status are extremely relevant. But I badly want personal health instrumentation too. That is what health Wearables and the biomarkers proposed here are about. Gradually over the years instruments were added to airplanes leading to the dozens of sophisticated instruments now expected and required to be in every cockpit. My first personal health instrument was a FitBit 1 which I started using over 15 months ago. It measured steps and flights of stairs climbed and provided an estimate of daily calorie expenditure. This was valuable information, but only a starter. Five months ago I added a Basis Peak smart watch which captures 24-7 heart rate, perspiration and skin temperature in addition to movement. That watch is capable of telling when I go to sleep and when I wake up, and of showing how my sleep breaks down into periods of REM sleep, light sleep and deep sleep, and it the Peak software displays how sleep correlates with heart rate and the other measurements it makes. I expect to continue with this process of improving my personal health instrumentation as long as I am functional. We will discuss additional instrumentation in the following blog entry, including the use of alternative Wearables and several more measurements complementary to those described here.
The biomarkers and health Wearables
The good news is that health Wearables are now being adopted by tens of millions of people – and some of these may, like the Basis Peak, be capable of recording the continuous heart rate measurements and other measurements enabling computation of the MRHR and SRR biomarkers identified here. I am thinking of ones like the Jawbone UP3 and the Fitbit Charge HR and the Fitbit Surge. And the most hyped and anticipated Apple Watch which may be worn by as many as 15 million people before the end of this year. All are reputed to be capable of 24-7 heart rate monitoring. Here is a recent review of Best heart rate monitor and HRM watches.
Except for the Peak, I do not know from direct experience how good these Wearables are for continuous heart rate monitoring and reporting, and for correlating heart rate with sleep. The Basis Peak is a second-generation device embodying an improved set of sensors involving two constantly blinking LEDs. The company designed the product based on its experience with its first generation wearable that was supposed to do more or less the same things – the Basis B1. As to my friends expecting that the Apple watch it will be their main health wearable, there appears to be both good news and bad news. The good news is that the watch seems to do a very good job and measuring heart rate. The bad news is its poor suitability to do the job when needed, that is, during sleep. The watch was designed to do so many things that it must be charged daily. The general suggestion is to wear it during the day and put it in the charger at night. Since the biomarkers described here must be based on measurements during sleep, this makes the Apple watch a possibly poor choice. I typically recharge my Basis Peak every 2-3 days for 1-2 hours during periods of relative daytime inactivity.
This Part 1 blog entry provided a snapshot of what was happening in personal health instrumentation as of four months ago, and this Part Three blog entry discusses another well established but more-difficult to measure stress biomarker, heart rate variability, HRV. I anticipate that a Part 5 entry will describe some additional health measuring Wearables that have just come on the market
Comment on the science behind the biomarkers
The Wearables part three blog entry examines heart rate variability (HRV), the physical factors which impact on HRV , and why HRV is a good indicator of constitutional stress state. The timing of each beat of the heart is determined by constant real-time coordination between parasympathetic and sympathetic nervous systems, the pulmonary, endocrine and digestive systems, in part by the action of the vagus nerve. How well this coordination is done is measurable by heart rate variability, the greater the heart rate variability the more the body is able quickly to accommodate to stresses. It is generally recognized that conditions of poor stress responsiveness are reflected by low heart rate variability and high resting heart rate. Heart rate variability is normally measured by looking at what goes on in the time frame of a small number of heartbeats, analyzing the timing of individual heartbeat events in milliseconds, R to R intervals, and event frequencies spectra. The biomarkers discussed in this blog entry are also measures of heart rate variability, but taken over much longer time frames, minutes hours and days. So, for example, the measure ERHR-MRHR measures the body’s ability to readjust to a lower heart rate overnight, and the variance in MRHR is also a measure of day to day HRV.
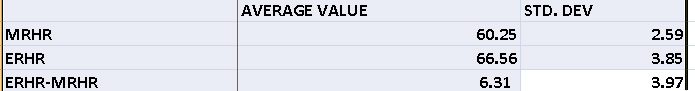
Going back to my personal situation, recall that my mean ERHR-MRHR over the period of observation is 6.31 with a standard deviation of 3.97 which initially impressed me as being a very large standard deviation. One way of looking at this is to think of it as possibly reflecting inconsistent or poor sleep or possibly systematic measurement errors. I now believe the large variation is simply a reflection of healthy macroscopic HRV. What is important as reflective of health is that the mean values of these measurements remain within reasonable boundaries, not at all necessarily what goes on in an individual day. And this observation applies as well for the large standard deviations in all the other heart rate measurements I have documented as above.
I expect that the Part 5 blog entry in this Wearables series will be authored by Jim Watson and myself and will explore the science behind these biomarkers in additional depth. That blog entry will be concerned with the physiologic phenomenon reflected by the various biomarkers and their relationship to body stress, stress responses, and constitutional preparedness to handle stresses. It will proposes additional measurement strategies and the use of alternative Wearables. Specifically, it will look at the practicality of combining these biomarkers with more traditional HRV biomarkers.

Pingback: Digital health – health and fitness wearables, Part 2: looking for practical stress biomarkers | AGINGSCIENCES™ – Anti-Aging Firewalls™
Vince
Any plans to update your anti-aging firewalls in the near future?
I know your present supplement regimen has seen several changes since the last time the firewalls were updated.
Cam
cam44:
Thank you thank for the reminder. I am painfully aware of how that document is becoming obsolete despite its many valuable features. I think I will updated it in two phases: a first update done soon to reflect my existing firewall regimen, probably with comments as to what is behind the changes. Then, a major rewrite probably requiring a month or two. There is generally nothing wrong with what is said in this treatise. However, several sections can be enhanced considerably by taking new or additional research into account. I am thinking of possibly making it into an e-book. Vince
I did a similar but shorter test w/ NR at first, then NMN. I saw a big difference w/ NMN despite the very low dosage (10mg per cap ; 1 cap a day), but rapidly felt return to normal. After having read your last articles on nad/nadh ratio, i started a few days ago adding beta lapachone to my daily NMN intake. For now, it’s a bit earlier to make conclusion, but you should give it a try, but paying attention to its lowering hypertension, which is quite strong.
Hi angusyoung
Thanks for sharing this. Interesting that your experience on NMN matches mine as reported. Would you mind sharing what your source of beta lapachone is? the supplier I identified seemed very expensive. On the other hand lapacho tea is readily available and very cheap. I just ordered some It contains beta lapachone along with several other components, some of which could be good too. I want to use my measures to see if it makes a difference while on NR.Please continue to share your experience.
Vince
Vince
very meaningful test, with more mechanism of such biomarkers mentioned in the blog will be found out to be beneficial to many other researches. And there is some knowledge about NADifloxacin http://www.bocsci.com/description.asp?cas=124-858-35-1&cid=1